The iCrossAD Indicator, also known as SCAD, is an invaluable tool for traders looking to identify potential reversals or price pullbacks. This indicator operates on the principle of the Accumulation/Distribution (A/D) line intersecting with a trend line that’s drawn from the extreme values of the A/D indicator.
In simple terms, if the A/D line crosses the trend line on the indicator chart, it’s likely that the price will also break through the corresponding trend line on the price chart. Therefore, a signal from this indicator often suggests that a reversal or a pullback is on the horizon.
What makes the iCrossAD Indicator even more versatile are its twenty-three adjustable parameters:
- AD Applied Volume — This sets the volume used in calculating the A/D.
- Bars for Calculation — The number of bars analyzed for intersections.
- Unchecked Bars — The last few bars to the right that are excluded as signals (this acts as a sensitivity filter).
- Filtering Indicator — Choose the type of filtering indicator you want to use:
- Without Filtration - No additional filtering applied.
- Filter by CCI - Utilize the CCI indicator for filtering signals.
- Use Default CCI Parameters — If you're using CCI for filtering, selecting 'Yes' will apply the default settings.
- CCI Period — The period used for CCI calculation when not using default settings.
- CCI Applied Price — The price used for CCI calculation when not using default settings.
- Upper Level of the Filter Indicator — Sets the upper limit for the filtering indicator.
- Lower Level of the Filter Indicator — Sets the lower limit for the filtering indicator.
- Draw Arrow on Chart — Enable to display signal arrows on the price chart (Yes/No).
- Arrow Size on Chart — Adjust the size of the signal arrows on the chart.
- Bullish Arrows Color — Choose the color for bullish arrows.
- Bearish Arrows Color — Choose the color for bearish arrows.
- Draw Trend Line — Enable to display a trend line on the A/D chart, which is used for finding intersections (Yes/No).
- Trend Line Thickness — Set the thickness of the trend line.
- Trend Line Style — Choose the style of the trend line.
- Downtrend Line Color — Select the color for the downtrend line.
- Uptrend Line Color — Select the color for the uptrend line.
- Draw Search Area — Enable to display the area where intersections are searched (Yes/No).
- Search Area Style — Choose how the search area is displayed:
- Fill - Solid fill.
- Frame - Outlined frame.
- Search Area Line Width (if Frame mode) — Set the line width if using frame mode.
- Search Area Line Style (if Frame mode) — Choose the line style for the search area in frame mode.
- Search Area Color — Set the color for the search area line or fill.
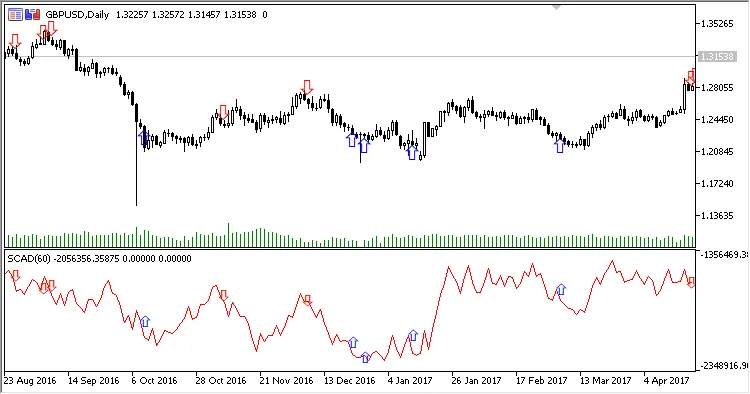
Fig. 1. SCAD with Default Settings
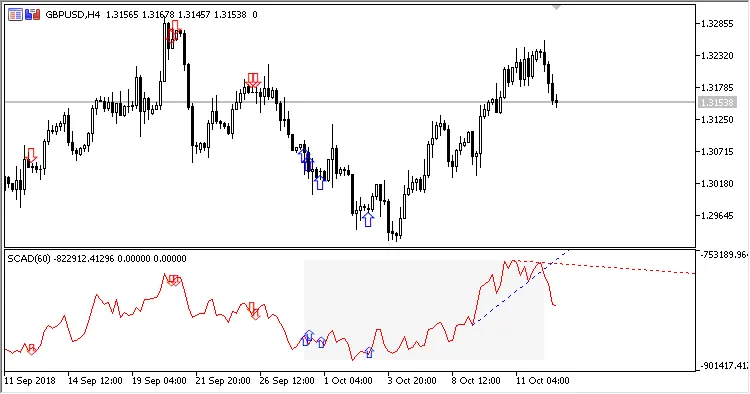
Fig. 2. SCAD with Trend Line and Search Area Enabled
Related Posts
- Mastering the Open Range Breakout Indicator for MetaTrader 5
- Unlocking the Power of Multi-Timeframe Tymen STARC Bands for MetaTrader 5
- ID Lite Info MA: A Comprehensive Indicator for MetaTrader 5
- Unlock Trading Insights with Volume Profile + Range v6.0 for MetaTrader 5
- Unlocking Trading Insights with Volume Profile + Range v6.0 for MetaTrader 5