Discover the Market Profile Indicator for MetaTrader 5 — This classic Market Profile tool is designed to provide traders with a clear view of price density over time. It highlights crucial price levels, the value area, and the control value for any given trading session. You can use this indicator on timeframes from M1 to D1, making it versatile for daily, weekly, monthly, or even intraday analysis. Lower timeframes give you more precision, while higher timeframes enhance visibility. You can even create a custom market profile on any timeframe using a free-draw rectangle session. Plus, with six different color schemes to choose from, you can easily visualize the profile's blocks, whether as a plain color histogram or color-coded based on bullish or bearish bars. This indicator relies solely on price action and does not incorporate any standard indicators. It's compatible with both MetaTrader 4 and MetaTrader 5.
Input Parameters
Main Settings
- Session (default = Daily) — Choose your trading session for the market profile: Daily, Weekly, Monthly, Intraday, or Rectangle. For a rectangle session, simply add a rectangle chart object with a name starting with MPR. You can press 'r' on your keyboard to quickly add a correctly named rectangle object.
- StartFromDate (default = __DATE__) — If StartFromCurrentSession is false, the indicator will begin drawing profiles from this specified date and will extend backward in time. For instance, if you set the date to 2018-01-20 and SessionsToCount is set to 2, it will draw profiles for both 2018-01-20 and 2018-01-19.
- StartFromCurrentSession (default = true) — If set to true, the indicator will start drawing from today; otherwise, it will use the date provided in StartFromDate.
- SessionsToCount (default = 2) — This parameter determines how many trading sessions will be drawn in the market profiles.
- SeamlessScrollingMode (default = false) — When set to true, the StartFromDate and StartFromCurrentSession parameters are ignored, allowing you to view sessions from the rightmost bar of the current chart position. This feature enables you to scroll back in time to analyze past sessions indefinitely.
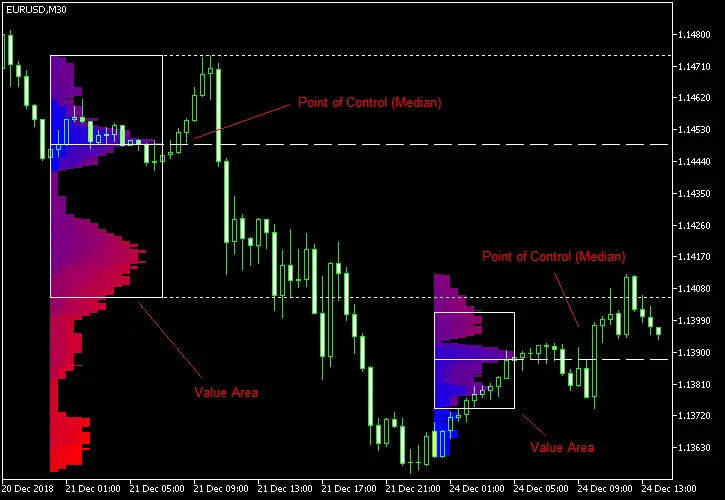
- EnableDevelopingPOC (default = false) — If set to true, multiple horizontal lines will be displayed to show how the Point of Control has evolved throughout the session.
- EnableDevelopingVAHVAL (default = false) — When enabled (true), this setting will draw multiple horizontal lines to illustrate how the Value Area High and Value Area Low developed during the session.
- ValueAreaPercentage (default = 70) — This percentage defines the share of the session's Time Price Opportunities (TPOs) that will be included in the Value Area.


Comments 0