When it comes to trading, having the right indicators can make all the difference. One such tool is the Drive Indicator, which can help you identify market trends effectively.
How to Read the Drive Indicator
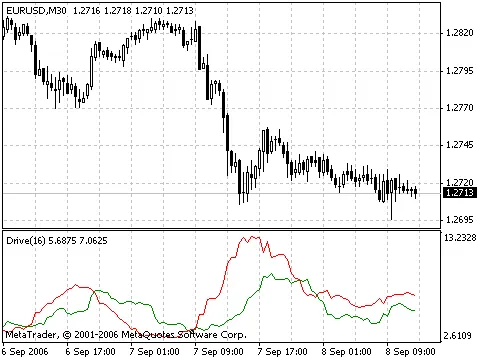
The Drive Indicator works on a straightforward principle:
- Green above Red indicates an upward trend.
- Red above Green signals a downward trend.
Choosing the Right Periods
For optimal results, consider using periods of 4, 16, or 128 for your calculations. These time frames can provide insights into the market movements that matter.
Calculating the Values
The Drive Indicator values are calculated as follows:
- Up (Green):
((High - Open) + (Close - Low)) / 2, averaged over your selected period. - Down (Red):
((Open - Low) + (High - Close)) / 2, also averaged over your selected period.
Get in Touch
It's worth noting that the Drive Indicator might resemble other existing indicators out there. If you've encountered something similar, I’d love to hear about it! Feel free to drop me an email at systrad5@yahoo.com.


Comments 0