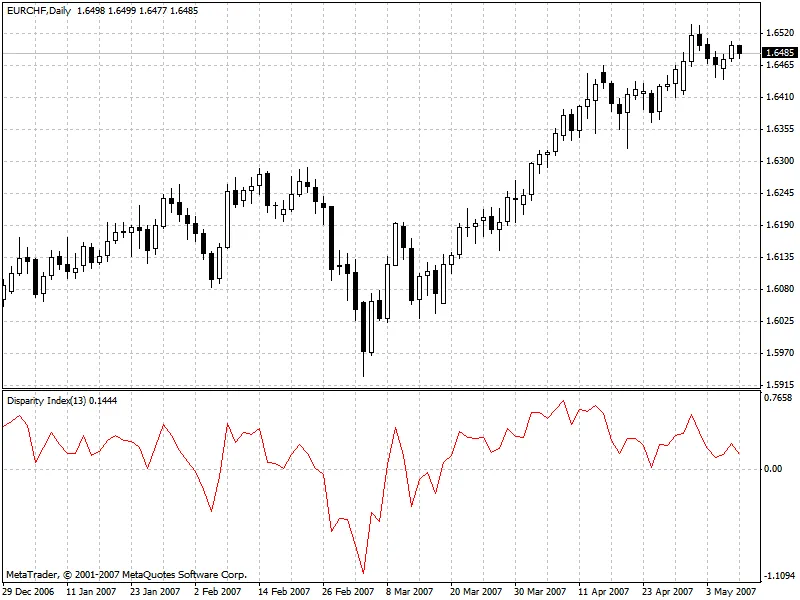
What is the Disparity Index?
As traders, we’re always on the lookout for tools that can give us an edge in the market. One such tool is the Disparity Index, a concept popularized by trading expert Steve Nison. This index shows the percentage difference between the latest closing price and a selected moving average. It’s a handy indicator for gauging market momentum and potential reversals.
The Math Behind It
The Disparity Index can be calculated using the following formula:
[ Mov(C,X,MA) ] * 100
In this formula, C represents the latest closing price, Mov(C,X,MA) is the moving average based on X periods and the chosen calculation method. Understanding this formula can really help you leverage the Disparity Index effectively in your trading strategy.
Diving Deeper
If you’re looking for a more comprehensive understanding of the Disparity Index, I highly recommend checking out Steve Nison's book, “Beyond Candlesticks”, particularly Chapter 5. It’s packed with insights that can sharpen your trading skills.
Using the Disparity Index in conjunction with other indicators can provide a clearer picture of market trends and help refine your trading approach. Remember, the key to successful trading is not just about understanding individual indicators but how they work together to inform your decisions.


Comments 0