The Choppiness Index is a fascinating tool that offers a fresh perspective on calculating fractal dimensions in trading.
What Is Choppiness?
Choppiness is a cutting-edge indicator rooted in chaos theory and fractal geometry. It was Benoit Mandelbrot who sparked widespread interest in fractal geometry by demonstrating its prevalence across various fields, including mathematics and nature. Mandelbrot illustrated how fractals can be found in everything from cloud formations to sunflowers, creating a remarkable connection between mathematical concepts and the natural world. With the help of IBM and computer graphics, he made these complex ideas visually accessible.
While most of us are familiar with whole number dimensions—like 1D, 2D, and 3D—fractal geometry introduces fractional dimensions that exist between these whole numbers. Essentially, fractals provide a way to measure the dimensionality of a system, offering a unique perspective on how different images can emerge based on these fractional dimensions.
Australian trader E. W. Dreiss had a brilliant idea: he leveraged fractal geometry to quantify price movements in securities. He assigned a “dimension” to price movement charts, where a trending, linear chart might represent a dimension of 1, and a completely choppy, non-trending chart would represent a dimension of 2. This approach opens the door to understanding various states of choppiness, which exist between these two extremes.
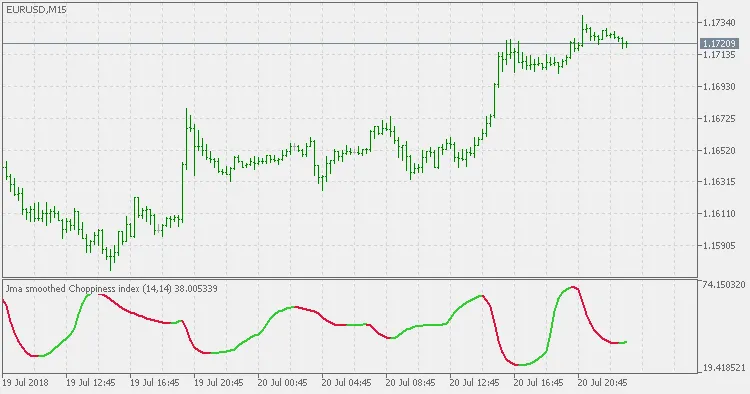
This version of the Choppiness Index incorporates JMA smoothing. This enhancement helps to make it easier to identify changes in the slope direction of the choppiness index and reduces the overall volatility of the values, making it a more reliable tool for traders.
Related Posts
- Unlocking MetaCOT 2: Your Ultimate CFTC Indicator Toolkit for MT4
- Unlocking the Power of Master Tools for MetaTrader 4
- Mastering the Open Range Breakout Indicator for MetaTrader 5
- Hourly Buffers for Data Collection in MetaTrader 5: A Simple Guide
- Unlock Trading Insights with Volume Profile + Range v6.0 for MetaTrader 5