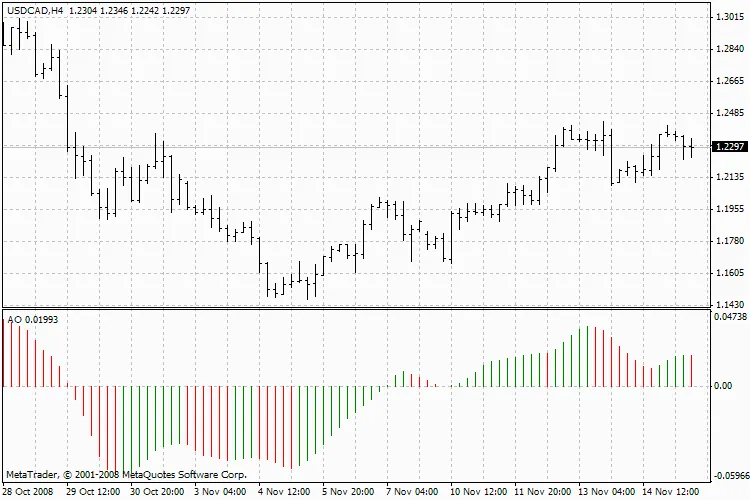
The Awesome Oscillator (AO) is a popular tool among traders, consisting of a 34-period simple Moving Average calculated from the median price of bars and subtracted from a 5-period simple Moving Average. Essentially, it helps us gauge the market's momentum at any given moment.
Buy Signals
Saucer Signal
This is the primary buy signal you’ll encounter when the AO bars are above the zero line. Here’s what you need to know:
The saucer signal forms when the bar chart shifts from downward to upward. You'll see the second column is lower than the first and colored red, while the third column is higher than the second and colored green.
For a valid saucer signal, there must be at least three columns in the bar chart.
Remember, all Awesome Oscillator columns should remain above the zero line for the saucer signal to be valid.
Nought Line Crossing
This buy signal occurs when the bar chart crosses from negative to positive values, moving through the zero line. Key points to consider:
Only two columns are needed for this signal; the first must be below the zero line, while the second crosses above it.
It’s important to note that buy and sell signals cannot occur simultaneously.
Two Pikes Signal
This is another buy signal that can happen when the bar chart is below the zero line. Pay attention to these details:
The signal is triggered with a downward pike (the lowest minimum) below the zero line, followed by another downward pike that is slightly higher (a lesser negative number).
Ensure that the bar chart remains below the zero line between the two pikes. If it crosses above, the buy signal is invalidated, but another buy signal (nought line crossing) may emerge.
Each new pike must be higher than the previous one, meaning it should be a lesser negative value closer to the zero line.
If another higher pike forms without crossing the zero line, this will generate an additional buy signal.
Sell Signals
Sell signals on the Awesome Oscillator mirror the buy signals but in reverse. The saucer signal now occurs below zero, while nought line crossing happens on the decline — where the first column is above zero and the second is below it. The two pikes signal also flips, now appearing above the zero line.
Calculation
The Awesome Oscillator is calculated as follows:
MEDIAN PRICE = (HIGH + LOW) / 2
AO = SMA(MEDIAN PRICE, 5) - SMA(MEDIAN PRICE, 34)
Where:
- SMA — Simple Moving Average.
Technical Indicator Description
For a deeper dive into the Awesome Oscillator, check out the full description in the Technical analysis: Awesome Oscillator.


Comments 0