The RSI Slowdown indicator is a powerful tool for traders looking to fine-tune their entries and exits. It operates on the principle that before both price and the RSI indicator make a turn, the rate of the RSI will start to slow down. By identifying these slowdown points, you can spot potential stagnation in the overbought or oversold zones of the fast RSI indicator.
This indicator can visually mark these zones using either arrows or stripes on your chart, depending on your preference set in the configuration. If you prefer a more streamlined approach, you can disable the RSI slowdown search in the settings, allowing the indicator to solely display when the RSI exceeds the specified levels: LevelMax and LevelMin.
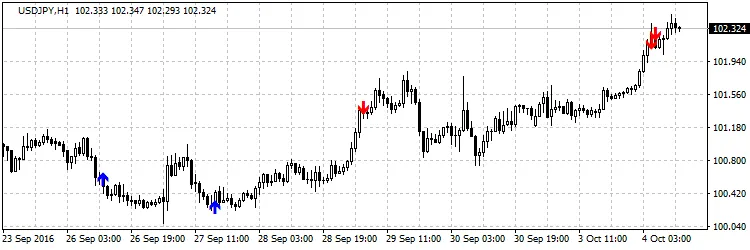
Version with arrows
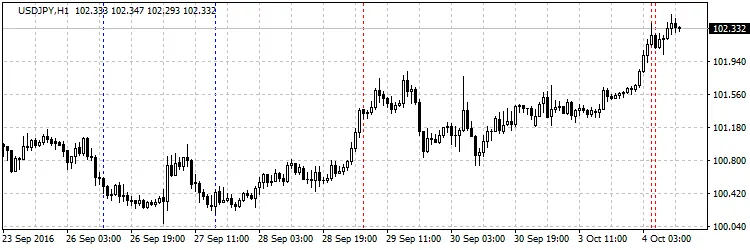
Version with lines
Settings:
- RSI Period — Set the period for the RSI calculation.
- Signal Level Max — The overbought level at which the indicator looks for deceleration.
- Signal Level Min — The oversold level at which the indicator searches for deceleration.
- Seek Slowdown — Toggle to enable or disable the slowdown search.
- Bar — Choose the bar for signal searching: 1 for the previously built bar, 0 for the current one.
- Type Graph — Decide whether you want arrows or lines for visual representation.
- Alerts — Enable sound alerts for when a signal is found.
- Buy Color — Set the color for buy arrows/lines.
- Sell Color — Set the color for sell arrows/lines.


Comments 0