The Market Profile is a powerful tool for traders, developed by the insightful Peter Steidlmayer. He found a way to visualize market activity through volume, represented as a bell-shaped curve. This unique perspective allows traders to interpret the objective information generated by the market effectively.
Market Profile offers an alternative way to present both horizontal and vertical market movements, resulting in a completely different set of models. When you look at the chart, you'll notice how it depicts an equilibrium market as a bell-shaped curve that’s rotated 90 degrees due to the orientation of the diagram.
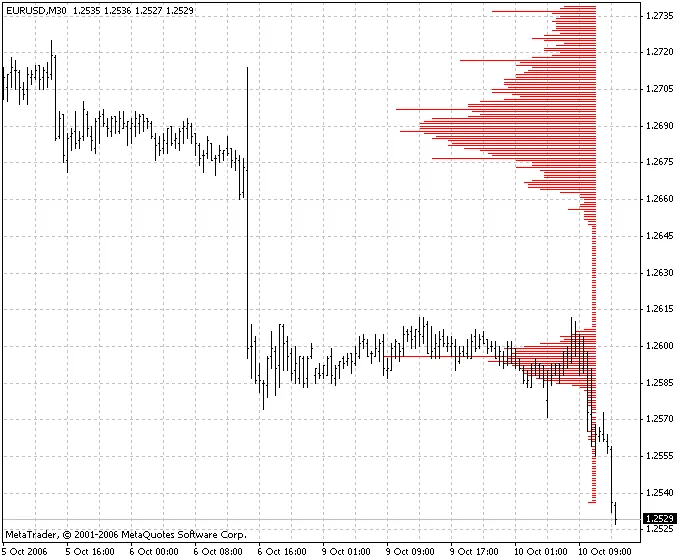
Instead of simply charting each time segment as a bar, Market Profile positions each segment in a specialized manner. For instance, take a look at how a standard 30-minute bar chart can be transformed into a Market Profile:
A long profile indicates that the price has remained stable for an extended period. This stability occurs when the market is in relative equilibrium, suggesting that, over time, there were numerous opportunities at a specific price level. Conversely, a short profile points to a swift move to a new price level, which typically happens when the market is out of equilibrium.
The outline of the profile reveals the relationship between vertical and horizontal movements, serving as a key to understanding trader behavior. The Market Profile not only indicates when the market is likely to shift from equilibrium to disequilibrium but also how significant that movement could be.
Key Parameters
- STEP: This represents the vertical step in points.


Comments 0