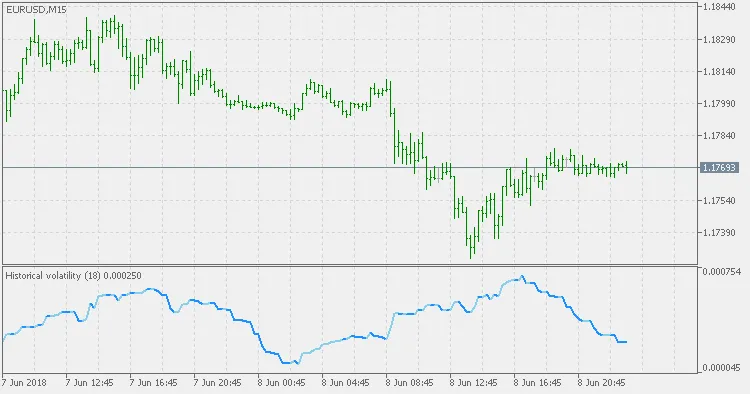
Hey fellow traders! Today, let’s dive into an essential concept that can really boost your trading game: Historical Volatility (HV). This nifty indicator measures how much a security’s price has varied over a specific period. Basically, it tells you how much the price has danced around its average, which can give you a clue about potential risks and rewards.
So, how do we crunch the numbers? The most common method is using standard deviation, but there are other ways to calculate HV as well. Keep in mind that a higher Historical Volatility value means more risk—this can be a double-edged sword. While it indicates greater price swings, it also opens the door for both bullish and bearish opportunities. Just remember, HV isn’t a directional indicator like some others. Instead, it’s best used to gauge the intensity of price movements.
In summary, harnessing Historical Volatility can be a game-changer in your trading strategy. By understanding the potential price fluctuations, you can make more informed decisions and manage your risk effectively. Happy trading!
Related Posts
- Maximize Your Trading Potential with the ColorX2MA_Alert Indicator for MetaTrader 5
- Unlocking the Power of ColorJFatl_Digit_Alert: Your Go-To MT5 Indicator
- Mastering the Waddah Attar Trend Alert Indicator for MetaTrader 5
- Unlocking BykovTrendAlert: Your Go-To Indicator for MT5 Alerts
- Unlock Trading Insights with Volume Profile + Range v6.0 for MetaTrader 5