Hey there, fellow traders! Today, let's dive into a handy tool that can enhance your trading experience on MetaTrader 5—an indicator that tracks your balance and equity in real-time.
This indicator is straightforward yet incredibly useful, especially for backtesting your trading strategies. It displays your balance and equity on a separate chart window, making it easy to visualize your trading performance.
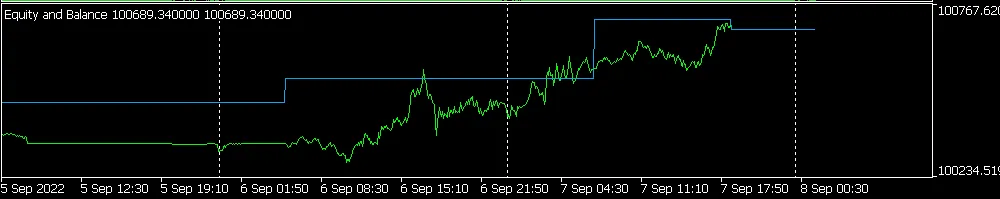
Here’s how it works: the blue line represents your balance over time, while the green line shows your equity and its fluctuations. This dual representation allows you to see how your account is faring at a glance.
Known Limitations:
It’s important to note that this indicator has its quirks. Due to its reliance on the AccountInfoDouble() method to read balance and equity, it can only show data from the moment you attach it to the chart. This means it won’t display historical data, which is why it shines during backtesting.
What’s great about this tool is that it allows you to zoom in and out just like you would with the regular chart. This feature is particularly beneficial for analyzing drawdowns closely, helping you make informed decisions based on your trading behavior.
Give it a try and see how it can assist you in your trading journey. Happy trading!


Comments 0