What's New in Version 6.0:
- We've added a second overbought/oversold level for better analysis.
- Introducing a new signal type: RSI2 crosses RSI1 (fast RSI crossing slow RSI).
- Histogram types have been updated to show either the RSI1 or MA1 histograms.
- You can now customize the second MA (MA2) to be MA, RSI1, or MA of MA1.
Features
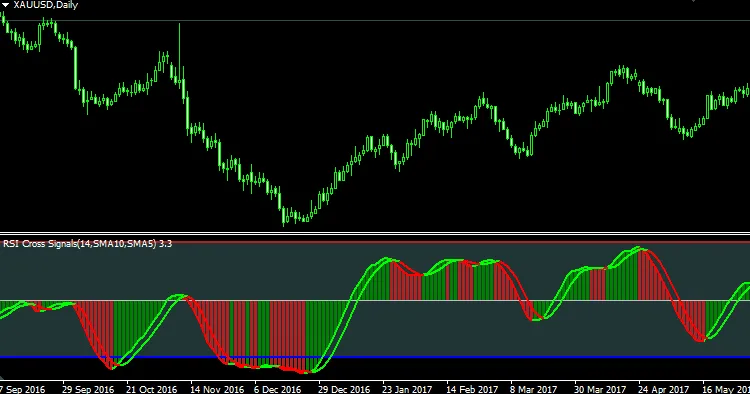
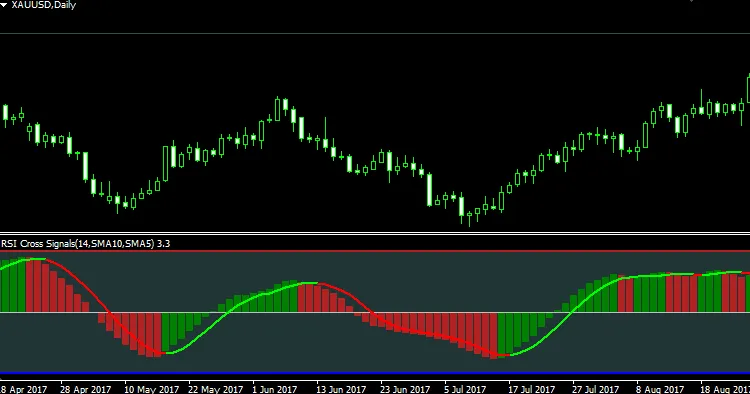
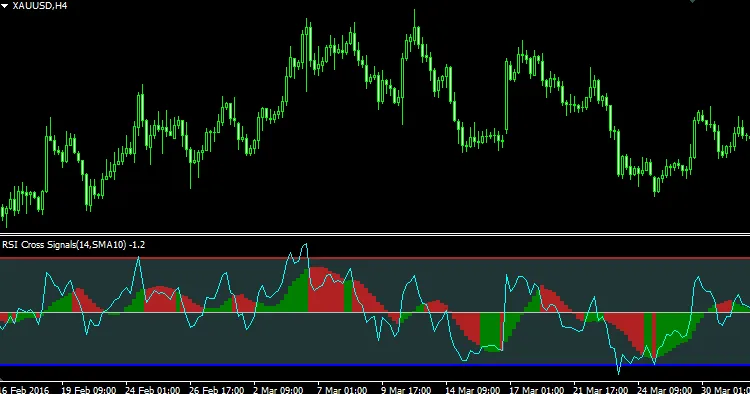
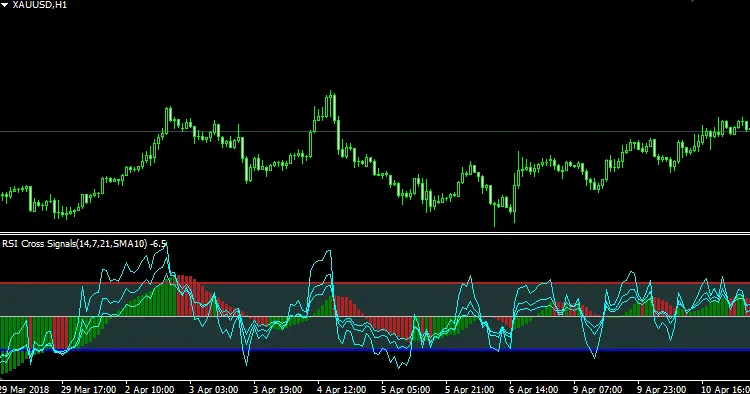
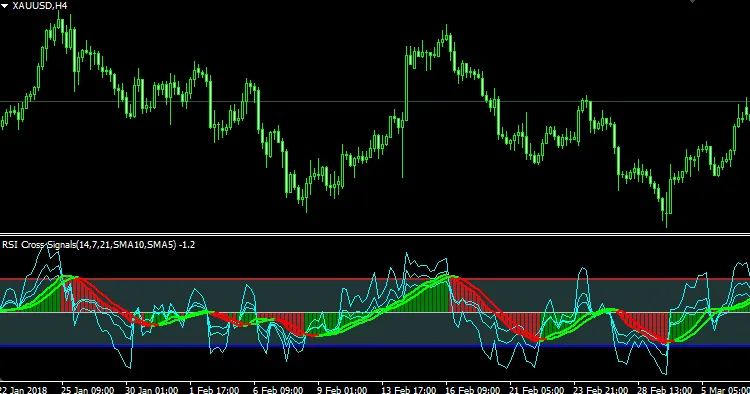
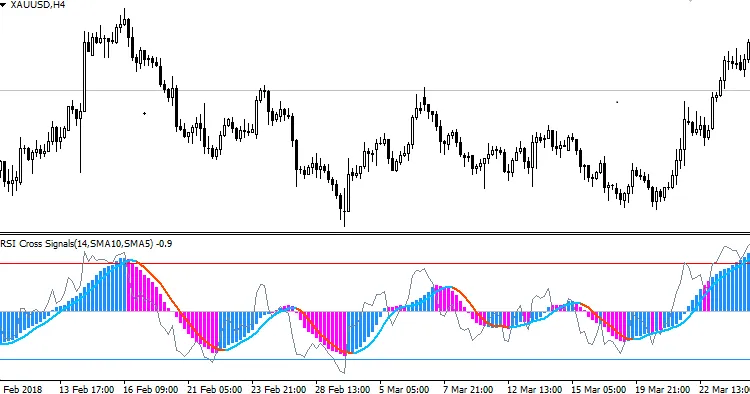
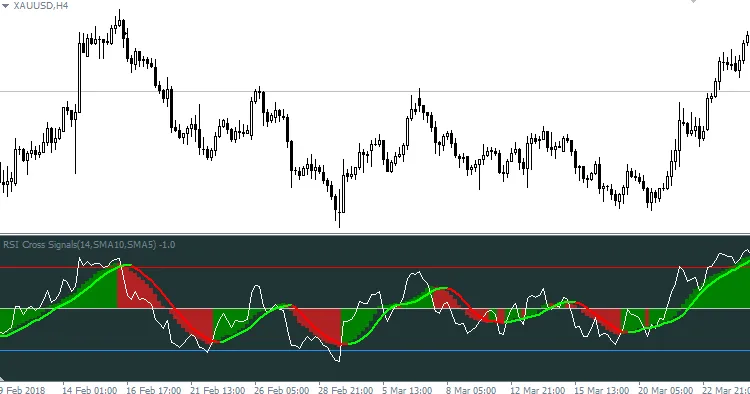
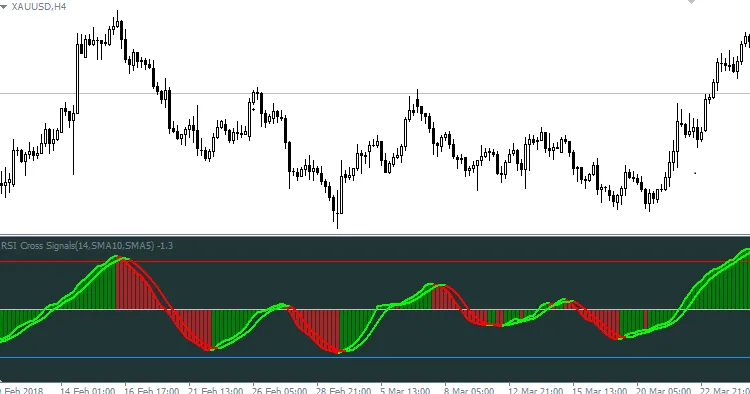
- Visualize 3 RSI lines of different periods along with the MA of the first RSI line (smoothed RSI).
- Get the MA of the smoothed RSI; the crosses between the smoothed RSI and its MA can serve as trading signals.
- Choose between histograms for RSI or its Moving Average.
- Enjoy color-coded level lines for clarity.
- Two-color MA lines for better visibility.
- Four-color histogram for enhanced data representation.
- Customizable background color filling between overbought and oversold levels.
- Flexibility to turn on/off most features as per your trading style.
Understanding the RSI Value of This Indicator
- The RSI value of this indicator = original RSI value - 50
- The overbought/oversold level = original overbought/oversold level - 50
This adjustment makes RSI fluctuate around 0 instead of 50, which is much easier for histogram representation.
Simply input your original overbought/oversold levels (like 70/30 or any other values), and the indicator will automatically adjust by subtracting 50.
Parameters
- RSI 1 Period - Set the period for RSI #1. If it's less than 2 or more than 100, the default (14) will be used.
- RSI 2 Period - Set the period for RSI #2. Default is 21 if out of range.
- RSI 3 Period - Set the period for RSI #3, with a default of 7 if out of range.
- Price Apply To - Select the price to apply for RSI calculation.
- Overbought Level - Define your overbought threshold (e.g., 70 or any custom level).
- Oversell Level - Define your oversell threshold (e.g., 30 or any custom level).
- Smooth Period - Specify the MA period for smoothing RSI #1.
- Smooth Method - Choose the MA method for smoothing RSI #1.
- MA Period - Specify the period for the second MA (MA of smoothed RSI #1).
- MA Method - Select the method for the second MA.
- Enable RSI 1 Line - Toggle the visibility of the RSI #1 line.
- Enable RSI 2 Line - Toggle the visibility of the RSI #2 line.
- Enable RSI 3 Line - Toggle the visibility of the RSI #3 line.
- Enable Smoothed RSI 1 - Toggle the visibility of the smoothed RSI #1 line.
- Enable MA of Smoothed RSI 1 - Toggle the visibility of the second MA (MA of smoothed RSI #1).
- Choose How to Draw Histogram - Three options for drawing histograms:
- Draw Histogram for RSI 1:
- Draw Histogram for Smoothed RSI 1
- Disable Histogram
- Choose How to Change Histogram Color - Two options for histogram color changes:
- As Per Smoothed RSI #1 Direction
- As Per RSI #1 and Smoothed RSI #1
Option 2 means: when RSI #1 crosses above the smoothed RSI, the histogram turns green, signaling a potential uptrend; when it crosses below, the histogram turns red, indicating a possible downtrend.
- Enable Background - If enabled, the indicator draws histograms between the Overbought and Oversell levels as a normal area background.
- Background for Whole Indicator Window - If enabled, background histograms will extend from top to bottom of the entire indicator window, available only if the "Enable Background" option is active.

Note
The default color settings are optimized for the "Green and Black" theme in MetaTrader 4. If you're using a "Black and White" setup, be sure to tweak the colors for better visibility against a white background.


Comments 0