If you're looking to gain an edge in your trading, the RSI Timeframe Analyzer is a must-have tool for your MetaTrader 4 setup. This powerful multi-timeframe RSI dashboard provides a clear visual representation of overbought, oversold, and neutral RSI conditions across nine different timeframes, from M1 to MN1.
Key Features
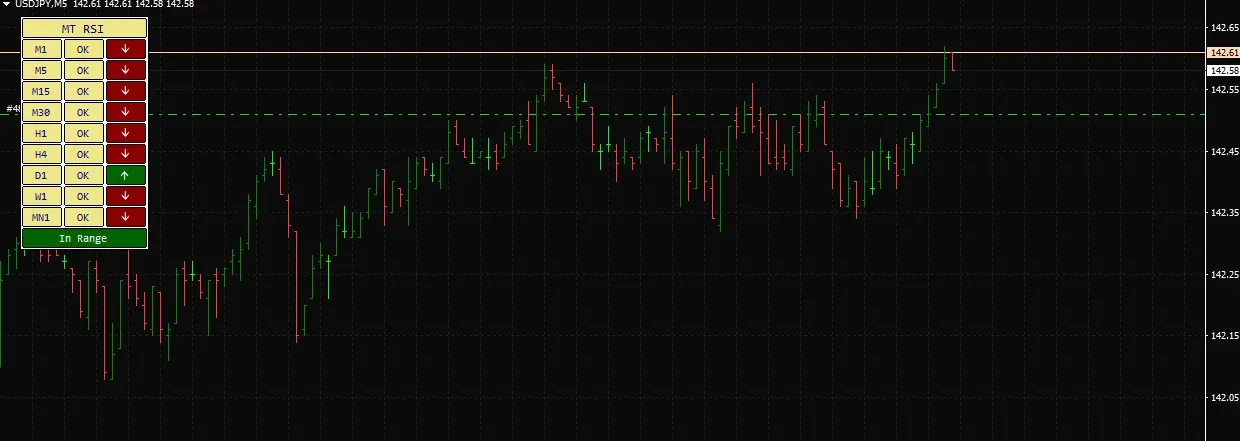
View RSI readings from M1 to MN1 all in one place
Easy-to-read color-coded statuses: Overbought, Oversold, In Range
Compatible with any chart or trading symbol
Using this indicator can help you quickly identify potential trade opportunities and make more informed decisions. So why wait? Give the RSI Timeframe Analyzer a try and see how it can elevate your trading game!


Comments 0