Welcome back, fellow traders! Today, we’re diving into the final version of an indicator that’s been shaped by insights from two informative forum threads:
We’ve introduced a new parameter called AMA_Trend_Type. This handy feature allows you to choose your preferred method for detecting trends.

We calculate this as: deltaAMA = AMA[0] - AMA[1]. The sensitivity for trend detection is based on points, represented as dK * Point.
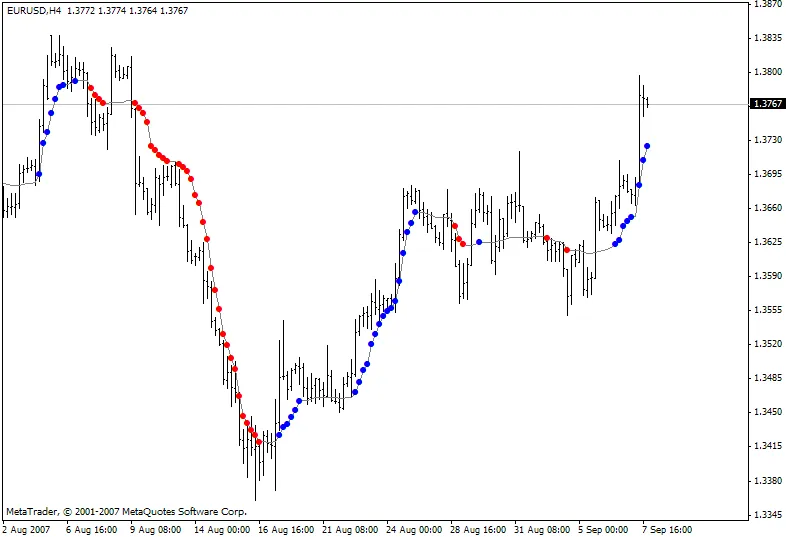
If deltaAMA > dK * Point, it indicates an uptrend, and a blue point will appear on the AMA line (as illustrated in the figure below).
If deltaAMA , it signals a downtrend, and a red point will be marked on the AMA line.
When AMA_Trend_Type is set to zero: We take an array of the latest AMA values over the specified PeroidAMA bars and calculate the standard deviation, referred to as StdAMA.
Here, the sensitivity for trend detection is based on standard deviations: dK * StdAMA.
If deltaAMA > dK * StdAMA, we’ll see a blue point indicating an uptrend. Conversely, if deltaAMA , a red point will signify a downtrend.
The default setting for AMA_Trend_Type is 1, using points for modification measurements.


Comments 0