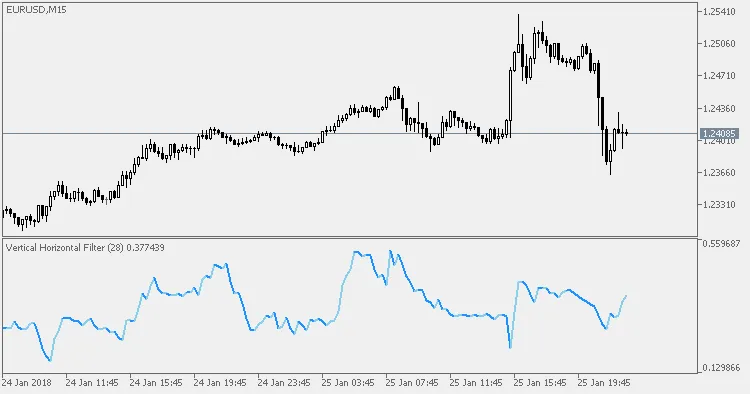
The Vertical Horizontal Filter, or VHF, is an invaluable tool for traders aiming to discern whether prices are in a trending phase or stuck in a congestion phase. This indicator was first introduced by Adam White in the August 1991 issue of Futures Magazine, and it has since become a staple in many traders' toolkits.
Understanding the VHF Indicator
One of the biggest hurdles in technical analysis is figuring out whether prices are trending or trading sideways. That's where the VHF comes into play—it helps you gauge the "trendiness" of prices, guiding your choice of indicators.
There are three main ways to interpret the VHF indicator:
- VHF Values: The actual VHF values reveal how strongly prices are trending. A higher VHF indicates a stronger trend, suggesting that trend-following indicators should be your go-to tools.
- Direction of the VHF: The trend direction of the VHF itself can signal whether a trending phase or a congestion phase is on the horizon. If the VHF is rising, a trend is likely developing; if it’s falling, prices may be entering a congestion phase.
- Contrarian Indicator: The VHF can also serve as a contrarian indicator. High VHF values often precede periods of price congestion, while low VHF readings can signal that a trending market is on the way.
Tips for Using the VHF
- It’s best to pair the VHF with other trending indicators. This will help you confirm whether the signals you’re seeing are indeed indicative of a trend or simply a range-bound market.
Related Posts
- Unlocking the Power of Master Tools for MetaTrader 4
- Hourly Buffers for Data Collection in MetaTrader 5: A Simple Guide
- Unlocking MetaCOT 2: Your Ultimate CFTC Indicator Toolkit for MT4
- Mastering the Waddah Attar Trend Alert Indicator for MetaTrader 5
- Maximize Your Trading Potential with the ColorX2MA_Alert Indicator for MetaTrader 5