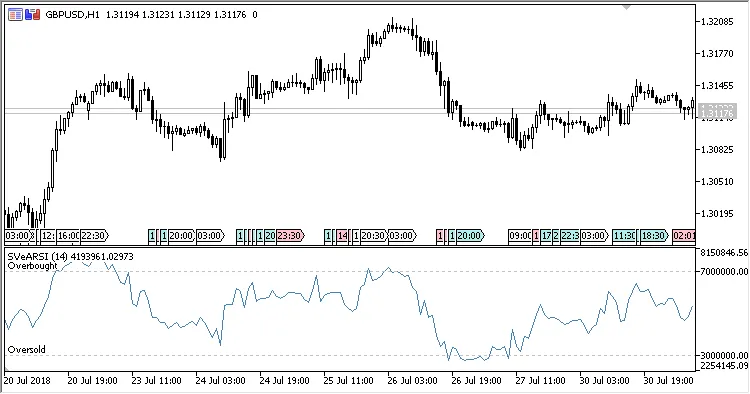
Hey there, fellow traders! Today, we're diving into the SVE_ARSI indicator—Sylvain Vervoort's Asymmetrical RSI, which was featured in the October '08 issue of Stocks & Commodities.
This powerful tool helps traders gauge market momentum with precision. Let's get into the nitty-gritty of its key parameters:
- Period - This sets the calculation timeframe.
- Applied Price - The price data you want to work with.
- Overbought - The threshold where the market might be overbought.
- Oversold - The level indicating potential oversold conditions.
Here’s how the calculations break down:
ARSI = 100.0 - 100.0 / (1.0 + RS)
Where:
RS = UpMove / DnMove
- If up = 0, then UpMove = 0.
- If up = 1, then UpMove = Up.
- Otherwise, UpMove = AvgUp.
- If dn = 0, then DnMove = 0.
- If dn = 1, then DnMove = Dn.
- Otherwise, DnMove = AvgDn.
AvgUp = EMA(Up, 2*Period-1)
AvgDn = EMA(Dn, 2*Period-1)
Up = Max(ROC,0)
Dn = Abs(Min(ROC,0))
ROC = Applied price - PrevApplied price
up = Floor(AvgUpCnt * Period + 0.5)
dn = Period - up
AvgUpCnt = SMA(UpCnt, Period)
- If ROC < 0, then UpCnt = 0.
- Otherwise, UpCnt = 1.
AvgUp = EMA(Up, 2*Period-1)
AvgDn = EMA(Dn, 2*Period-1)
Related Posts
- Unlocking MetaCOT 2: Your Ultimate CFTC Indicator Toolkit for MT4
- Mastering the MACD Candle Indicator for MetaTrader 4
- Unlocking the Power of Master Tools for MetaTrader 4
- Hourly Buffers for Data Collection in MetaTrader 5: A Simple Guide
- Unlock Trading Insights with Volume Profile + Range v6.0 for MetaTrader 5