If you've been trading for a while, you know the importance of using multiple timeframes to get a clearer picture of market trends. That's where the Multi-Timeframe RSI (Relative Strength Index) comes into play. This handy oscillator displays the data from three RSI indicators, each taken from different timeframes, all on your current chart.
Let’s dive into the seven key input parameters that you can customize:
- RSI Period - This defines the period used for calculating the RSI.
- Overbought - Set your overbought level here.
- Oversold - This parameter sets your oversold level.
- Drawing Mode - Choose how the indicator is drawn on your chart:
- Steps - Displays the data in a ladder-like format.
- Slope - Shows the data as sloping lines.
- First RSI Timeframe - Specify the timeframe for your first RSI.
- Second RSI Timeframe - Set the timeframe for your second RSI.
- Third RSI Timeframe - Define the timeframe for your third RSI.
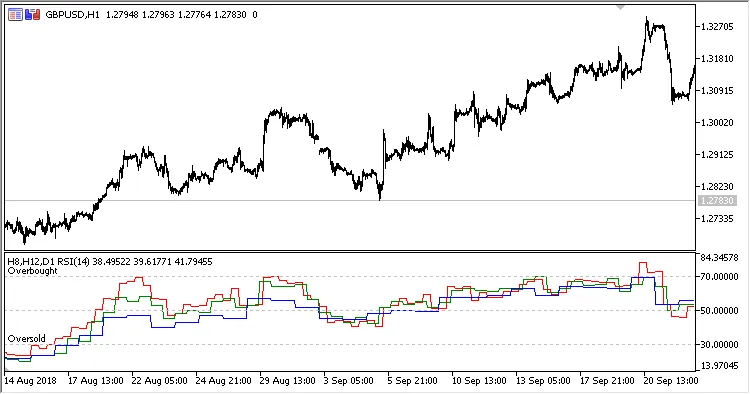
Fig.1. Multi-Timeframe RSI showing H8, H12, and D1 data on an H1 chart with Drawing Mode set to Steps
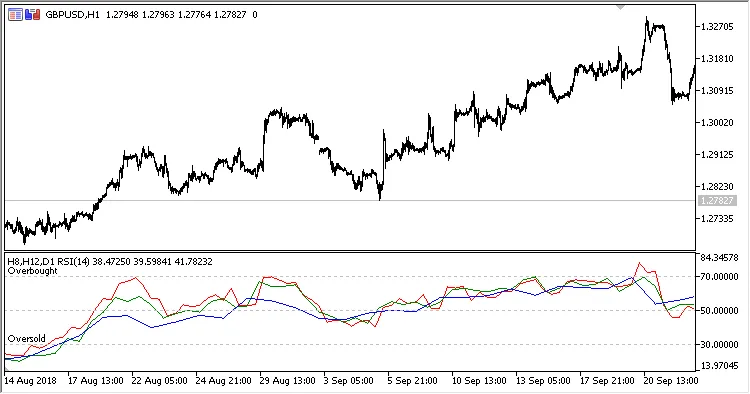
Fig.2. Multi-Timeframe RSI showing H8, H12, and D1 data on an H1 chart with Drawing Mode set to Slope
Related Posts
- Unlocking MetaCOT 2: Your Ultimate CFTC Indicator Toolkit for MT4
- Unlocking the Power of Master Tools for MetaTrader 4
- Unlock Trading Insights with Volume Profile + Range v6.0 for MetaTrader 5
- Mastering Trading with the MultiLineMovingAverage Indicator for MetaTrader 5
- Mastering the FE Fibonacci Expansion Indicator for MetaTrader 4