Understanding the Impulse MACD Indicator
The Impulse MACD is built on a system that combines three key moving average indicators. When you add these to your chart, you'll really start to see how they work together.
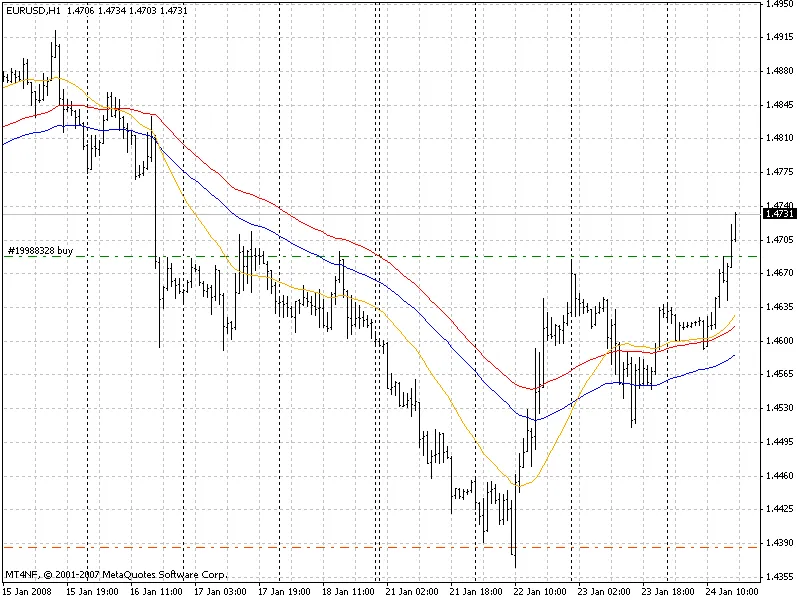
- First Indicator: SMMA MA of High
- Second Indicator: SMMA MA of Low
These two lines create a channel on your chart.
- Third Indicator: LWMA MA of Weighted – this serves as the impulse signal line. While the concept might not be groundbreaking, the way we construct the histogram offers a fresh perspective.
Why Track MACD Values?
You might wonder why it’s essential to keep an eye on MACD values, even when they seem irrelevant. The answer lies in decluttering your chart. By focusing on the position of the impulse signal line relative to the channel lines, you can spot key opportunities:
- If the impulse line is above the High value, you calculate divergence as the difference between the impulse and the High.
- If it dips below the Low, you calculate the difference between the impulse and Low.
This method helps eliminate intermediary movements, giving you a clearer picture.
Additionally, you’ll find a signal line in the histogram typical of the MACD indicator.
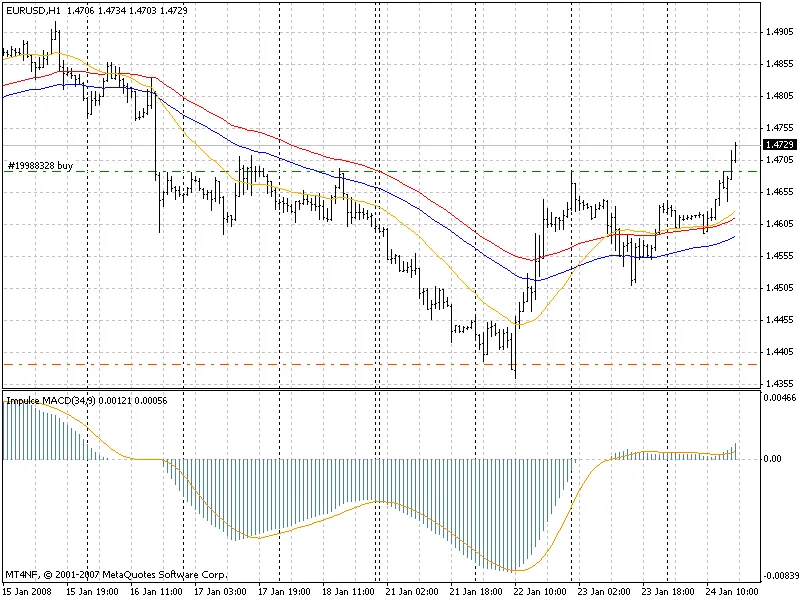
Trading with the Impulse MACD
The trading strategy here is straightforward: only enter trades when the histogram crosses the zero line. If the direction changes, set a trailing stop and wait for the next crossover, especially if a stop triggers. This way, you’re capitalizing on the initial price movement impulse.
By mastering the Impulse MACD, you’ll enhance your trading decisions and better navigate the markets.


Comments 0