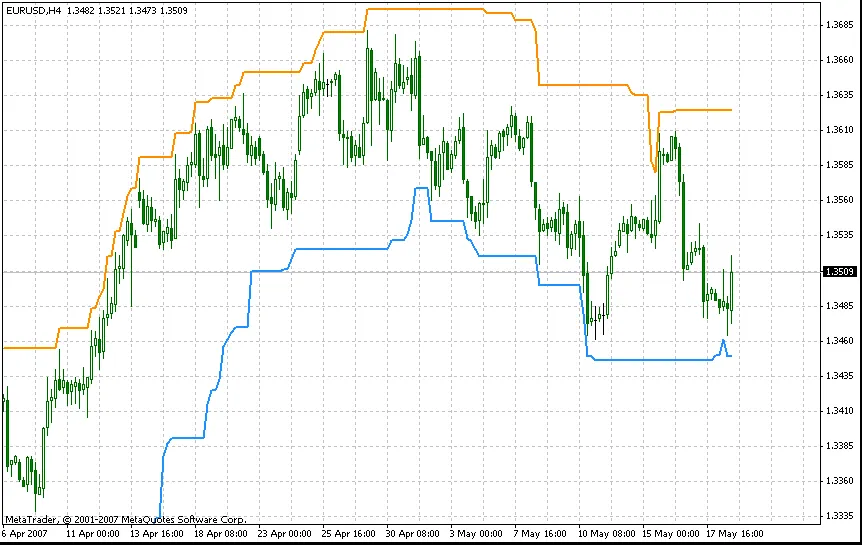
Hey traders! Today, let's dive into the i-HighLow indicator, a fantastic tool that helps you visualize price movement by highlighting the highest highs and lowest lows over a specified number of bars.
This indicator draws a channel, making it easier for you to spot potential trading opportunities. Here's a quick breakdown of its key parameters:
- extern int N = 20; - This parameter allows you to search for the highest and lowest values over the last 20 bars.
- extern int N2 = 5; - This one adds a 5-point offset on the price axis for drawing the channel borders.


Comments 0