The Fisher Indicator for MetaTrader 5 is a straightforward yet powerful histogram tool that helps you gauge the direction and strength of market trends while signaling potential trend reversals. Unlike standard indicators you might find on MT4 or MT5, the Fisher Indicator relies solely on advanced calculations derived from previous price highs and lows. This custom approach makes it a unique asset in your trading arsenal.
Understanding the Fisher Indicator
This indicator operates by analyzing the relationship between current prices and past extremes, making it a key player in identifying market shifts. Keep in mind, though, that it’s a repainting indicator; it recalibrates past bars as new data comes in, so you need to be patient when interpreting its signals.
Input Parameters
- Period (default = 10) — This setting determines the number of bars used to calculate the maximum and minimum price levels. A higher period value will reduce false trend signals but may lag in responsiveness.
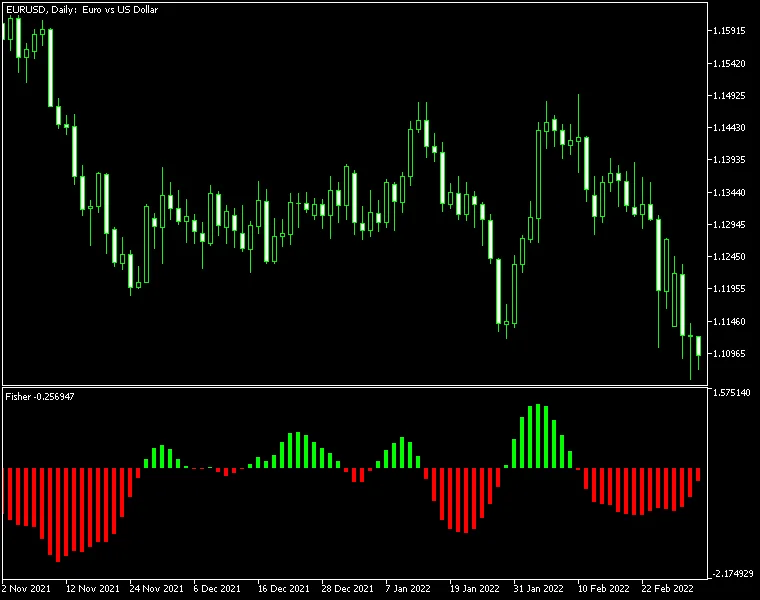
In the chart example above, you'll notice that upward trends are represented by green histogram bars, while downward trends show up as red bars. Trading with the Fisher Indicator is quite intuitive: you can close your short positions and enter long trades when the histogram shifts from red to green. Conversely, if the bars turn from green to red, it's time to exit long positions and consider shorting. With the default period setting of 10, it’s shown to be quite effective on the EUR/USD H1 chart. However, be aware that you'll need to wait for a few bars before acting on any signals, as repainting can change the indicator’s readings.


Comments 0