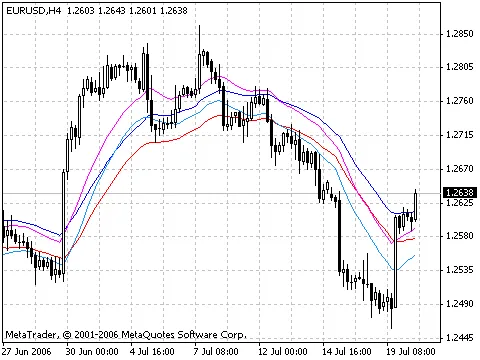
Understanding the EMA Trend Indicator
The Exponential Moving Average (EMA) Trend Indicator is a go-to tool for many traders looking to gauge market momentum. Unlike simple moving averages, the EMA gives more weight to recent prices, making it a favorite among those who want to stay ahead of the curve.
In this post, we'll dive into how you can effectively use the EMA in your trading strategy.
Why Use the EMA?
- Timely Signals: The EMA reacts quicker to price changes, helping you spot trends before they fully develop.
- Clear Trend Direction: By examining the slope of the EMA, you can easily determine whether the market is trending up or down.
- Versatile Application: The EMA can be used for various timeframes, making it suitable for day traders and long-term investors alike.
How to Implement the EMA in Your Trading
To get started with the EMA, follow these simple steps:
- Choose Your Timeframe: Decide whether you're day trading or looking at longer-term positions.
- Set Your EMA Period: Common choices include 9, 21, or 50 periods, depending on your strategy.
- Look for Crossovers: A bullish signal occurs when the price crosses above the EMA, while a bearish signal happens when it crosses below.
By keeping an eye on these signals, you can make more informed trading decisions and potentially enhance your profitability.


Comments 0