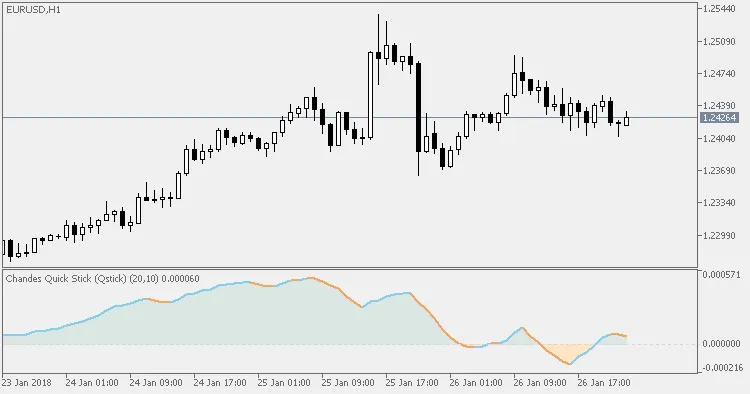
The Chande Qstick indicator, crafted by the brilliant mind of Tushar Chande—a scientist, inventor, and trader—serves as a powerful tool for identifying market trends through candlestick analysis.
When the Qstick shows a reading below zero, it signals that most of the candlesticks within the analyzed timeframe are bearish, suggesting a bearish bias for the trading instrument. Conversely, a reading above zero indicates that the majority of candlesticks are bullish, pointing towards a bullish bias.
Traders can leverage the Qstick in several impactful ways to generate trading signals:
- Crossing the Zero Line: A crossover above the zero line is a green light to buy, while a crossover below it suggests it’s time to sell.
- Extreme Levels: If the Qstick dips to very low levels and starts to reverse upwards, it’s often a buy signal. Conversely, if it reaches high levels and begins to turn down, consider it a sell signal.
- Divergences: Look out for divergences: if the market is making lower lows while the Qstick is printing higher lows, that's a bullish divergence—time to buy! On the flip side, if the market achieves higher highs and the Qstick creates lower highs, it’s a bearish divergence—a signal to sell.
Related Posts
- Unlocking MetaCOT 2: Your Ultimate CFTC Indicator Toolkit for MT4
- Unlocking the Power of Master Tools for MetaTrader 4
- Understanding the ChandeQStick Indicator for MetaTrader 5: A Trader's Guide
- Unlock Trading Insights with Volume Profile + Range v6.0 for MetaTrader 5
- Mastering the Open Range Breakout Indicator for MetaTrader 5