Hey there, fellow traders! If you’re looking to sharpen your game, let’s dive into the Pivot Star indicator for MetaTrader 4. This handy tool draws current pivot points without cluttering your chart with historical data. It’s all about keeping things clean and straightforward.
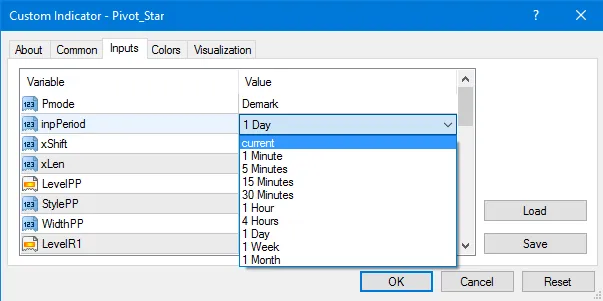
With Pivot Star, you’ve got options! Choose from various pivot calculations like Standard, Fibonacci, Camarilla, Woody's, and Demark. The calculations are based on the previous bar of your selected period, making it a versatile choice for any trading strategy.
double xClose=iClose(0, inpPeriod, 1);
double xHigh=iHigh(0, inpPeriod, 1);
double xLow=iLow(0, inpPeriod, 1);
The default setting is H1, which is perfect for scalping. It’s quick, efficient, and gives you the insights you need, right when you need them.

inputint xLen = 25; // Line Length
- xShift allows you to position pivot lines relative to the first bar (a positive number shifts to the right).
- xLen sets the length of lines based on the number of bars.
Plus, the indicator draws two additional lines for the previous day's High and Low, giving you even more context for your trades.
You can customize every line to your heart's content: change the color, style, and thickness. If you want to disable a line, just set its color to None.

Thicker lines indicate the previous day's High/Low, and these are only drawn on time frames lower than D1.

Camarilla Pivot includes L3, L4, L5, H3, H4, and H5 lines. It omits other points since they're not really necessary.
Keep in mind, if your viewing time frame is larger than the indicator's set period, the lines won’t be drawn. Otherwise, they might just clutter your chart.
if(inpPeriod>=Period())
{
if(Period()<=1440)
{
DrawLevel("Yesterdays High", xYH, StyleYH, WidthYH, LevelYH);
DrawLevel("Yesterdays Low", xYL, StyleYL, WidthYL, LevelYL);
}
DrawLevel("R3", xR3, StyleR3, WidthR3, LevelR3);
DrawLevel("R2", xR2, StyleR2, WidthR2, LevelR2);
DrawLevel("R1", xR1, StyleR1, WidthR1, LevelR1);
DrawLevel("PP", xPP, StylePP, WidthPP, LevelPP);
DrawLevel("S1", xS1, StyleS1, WidthS1, LevelS1);
DrawLevel("S2", xS2, StyleS2, WidthS2, LevelS2);
DrawLevel("S3", xS3, StyleS3, WidthS3, LevelS3);
}
As a quick update from June 5, 2017, we’ve made a few tweaks. The option to show the Previous Day's High/Low is now optional. Plus, you can run multiple instances for different time frames—ideal for tracking daily, weekly, or even monthly pivots.


Comments 0