Divergence is a powerful strategy for identifying potential price reversals at key support and resistance levels. It often provides earlier signals than traditional moving average indicators, making it an invaluable tool for traders. You can apply this technique to a variety of technical indicators to boost your trading results.
This indicator specifically plots divergence lines between the price and the OsMA indicator, generating buy or sell signals based on the type of divergence detected. Plus, it has the capability to draw divergence lines for the entire price history available on your chart.
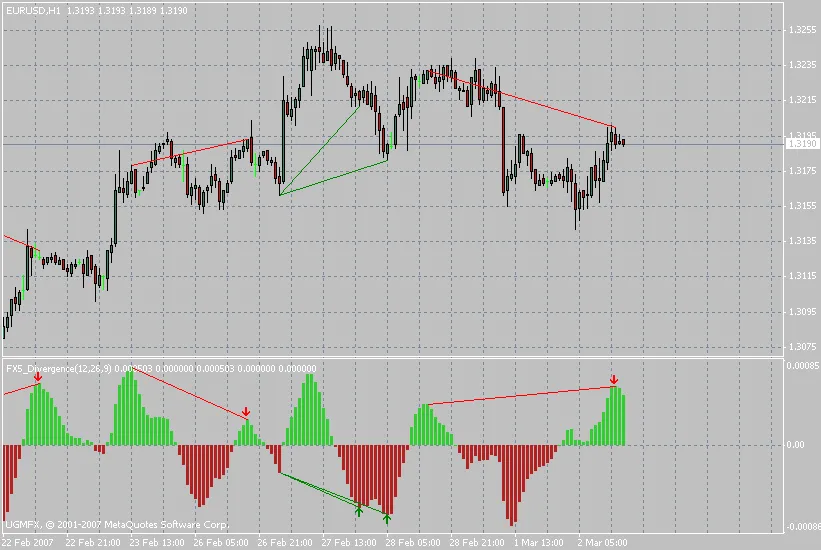
Bullish divergence is marked with green lines on both the price and OsMA indicator windows.

Conversely, bearish divergence is highlighted with red lines on the same windows.
I hope you find this indicator to be a valuable addition to your trading toolkit!
Updates and Enhancements:
Changes in Version 1.5:
- Fixed an issue with updating divergence lines as live quotes flow in.
- Added a sound alert feature, which can be toggled on or off in the indicator settings.
- Classical divergence is displayed with solid lines, while hidden divergence appears as dotted lines.
Changes in Version 2.0:
- Rebuilt the code from the ground up for improved speed.
- Eliminated any repainting of signals.
- Improved signal identification algorithms for greater accuracy.
Version 2.1:
- Corrected an attachment error; this is the final version, designated as version 2.1.


Comments 0