Understanding candle direction goes beyond just comparing Open and Close prices.

The ms-Candle indicator offers a fresh perspective by evaluating not only the Open and Close prices but also identifying gaps in quotes. This is crucial, as relying solely on Open and Close can often lead to misinterpretations of price action.
The indicator employs an empirical approach to assess candle direction more accurately. For instance, if a candle body exceeds two-thirds of its total size, it may suggest a different trend than what you’d expect from just Open/Close comparisons.
To calculate this, the indicator evaluates several statistical characteristics from a series of quotes. It generates a structured output called TCandlesStats, which includes boundary values for minimum and maximum candle sizes, as well as an estimate for what constitutes an 'average' or 'normal' candle. Both the height of the candle and the height of its body are considered in this analysis.
As the indicator processes data, it continuously updates its calculations whenever at least one-third of the data window has passed, ensuring that the results reflect current market conditions accurately.
When assessing price gaps, the indicator leverages the maximum candle size from its statistical analysis. While some traders might prefer using a price deviation channel for a more precise definition, the ms-Candle indicator simplifies this process significantly.
Each bar undergoes a detailed calculation, resulting in a TCandleInfo structure that provides clear insights into the current candle's direction. The calculations are executed as a macro, making the process streamlined and efficient.
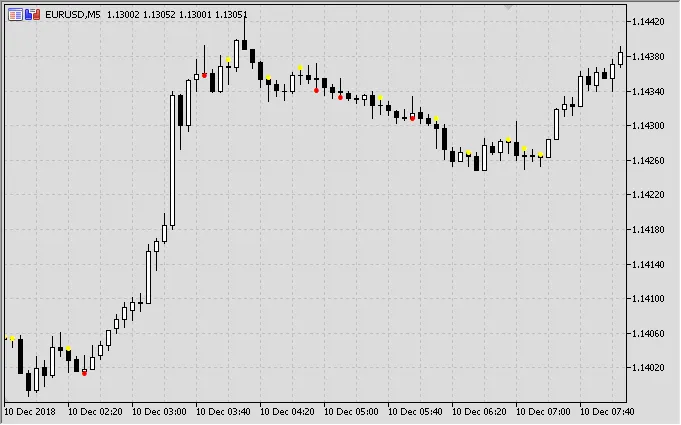
The chart displays vital information about candle direction and any identified gaps. You have the flexibility to toggle the direction display on or off and can choose to filter gaps based on their size. However, gaps in quotes will always be visible.
The visual representation includes:
- Low - indicates a downward candle (red)
- Hi - indicates an upward candle (yellow)
- Double Arrow - signifies a gap
- Scissors - denotes a significant price gap
The placement of these icons reflects the most recent price movement direction, giving you a clear picture of market dynamics.
Version Changes:
- 1.01: Fixed the direction estimation algorithm and updated the TCandleInfo structure.
- 1.02: Corrected candle direction display on the 0 bar.
- 1.03: Enhanced GetSomeStats function for accurate calculations across all bar shifts.
- 1.04: Added a feature to clean up all drawing buffers—previously, gap info was drawn on every bar.
- 1.05: Introduced automatic gap size calculation display.
- 1.06: Normalized maximum candle size within the direction estimation algorithm, aligning with the ms-Candle-Index indicator.
- 1.07: Minor corrections and updates to the description.
For MetaTrader 4 users, simply change the file extension to .mq4 or download it here.
Related Posts
- Unlock Trading Insights with Volume Profile + Range v6.0 for MetaTrader 5
- Mastering the Open Range Breakout Indicator for MetaTrader 5
- Hourly Buffers for Data Collection in MetaTrader 5: A Simple Guide
- ID Lite Info MA: A Comprehensive Indicator for MetaTrader 5
- Optimize Your Backtesting with the New Economic Calendar Tool for MetaTrader 5