If you’re trading with OandaX, you’re in for a treat! This product series offers a fantastic way to dig deeper into your trading data, thanks to the Oanda FxLabs service.
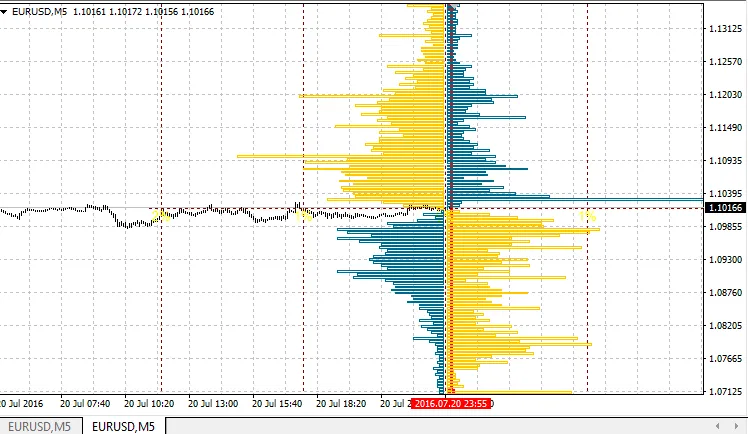
The OandaX OrderBook Chart indicator is a game changer. It provides a detailed histogram of orders and positions on your selected instrument, all tied to the specific time you set on the chart (indicated by a vertical line). For real-time updates, make sure the OandaX Download Manager EA is running in your terminal; however, you can view previously downloaded data without it.
This indicator showcases how to pull data from the histogram downloaded by the EA. The histogram's scale is directly linked to your chart, which means it will plot on the chart area rather than a user-defined location. You'll also see the time for which the histogram is drawn displayed in the top left corner using the Comment function.
If your vertical line is at the 0 bar (or to the right of it, indicating future history), it will automatically shift right when a new bar forms. This ensures you’re always in the loop with the latest data.
- Order Book (OrderBook) or Open Orders: This histogram reveals the distribution of limit and stop orders across price levels. Limit orders include Buy Limit and Take Profit levels, while stop orders include Sell Limit and Stop Loss levels.
- Position Book (Open Positions): This histogram shows where traders have opened their active positions based on the price at the time of histogram creation.
You can access this information for 16 instruments: AUDJPY, AUDUSD, EURAUD, EURCHF, EURGBP, EURJPY, EURUSD, GBPCHF, GBPJPY, GBPUSD, NZDUSD, USDCAD, USDCHF, USDJPY, XAUUSD, XAGUSD.
Keep in mind that the minimum history data step is 20 minutes, but depending on the depth of history, this could stretch up to 24 hours, and you might encounter unexpected gaps.
You have four formats to display histograms for both orders and positions:
- Basic: Shows a straightforward histogram without any additional processing.
- Cumulative: Adds all previous levels to each level for a cumulative view.
- Simple Difference: Displays the difference between short and long orders instead of individual positions.
- Cumulative Difference: Shows the difference for the cumulative histogram.
Note that data is downloaded and saved in UTC time. To ensure the histogram displays correctly, make sure your broker’s server time zone is set accurately in relation to UTC within the indicator settings.
Indicator Parameters
- Use Custom Instrument — True: Select this if you’re using non-standard instrument names or want to show a histogram for a different instrument on your chart.
- Custom Instrument Name: Enter the instrument’s name as recognized by Oanda FxLabs. For example, EURUSD would be EUR_USD, Gold is XAUUSD or XAU_USD, and Silver is XAGUSD or XAG_USD.
- Server UTC Time Offset: Set your server’s time zone relative to UTC.
- Show Histogram Cumulative: If set to True, this draws a cumulative histogram where previous levels are added to each subsequent level.
- Show Histogram Difference: If True, this displays the horizontal difference, not only showing buy or sell levels but their difference as well. It also works in cumulative mode.
- Show Orders (Positions if False): If set to True, this displays the histogram of orders. If False, it shows the histogram of positions, indicating where current positions were opened in terms of price levels.


Comments 0