Hey fellow traders! Today, I’m excited to dive into the ColorXMA_Ishimoku_StDev indicator for MetaTr...
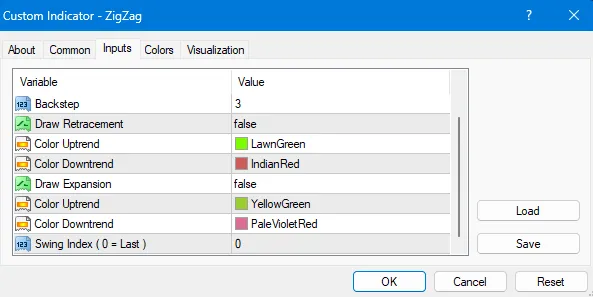
Description: If you’re looking to step up your trading game, the ZigZag Fibo indicator for MetaTrad...
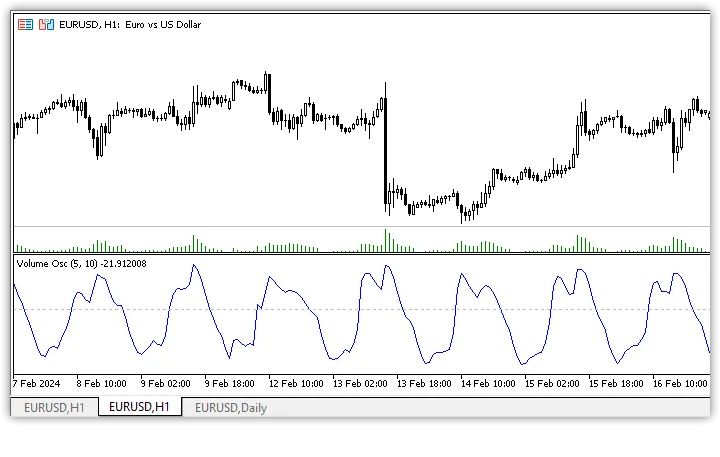
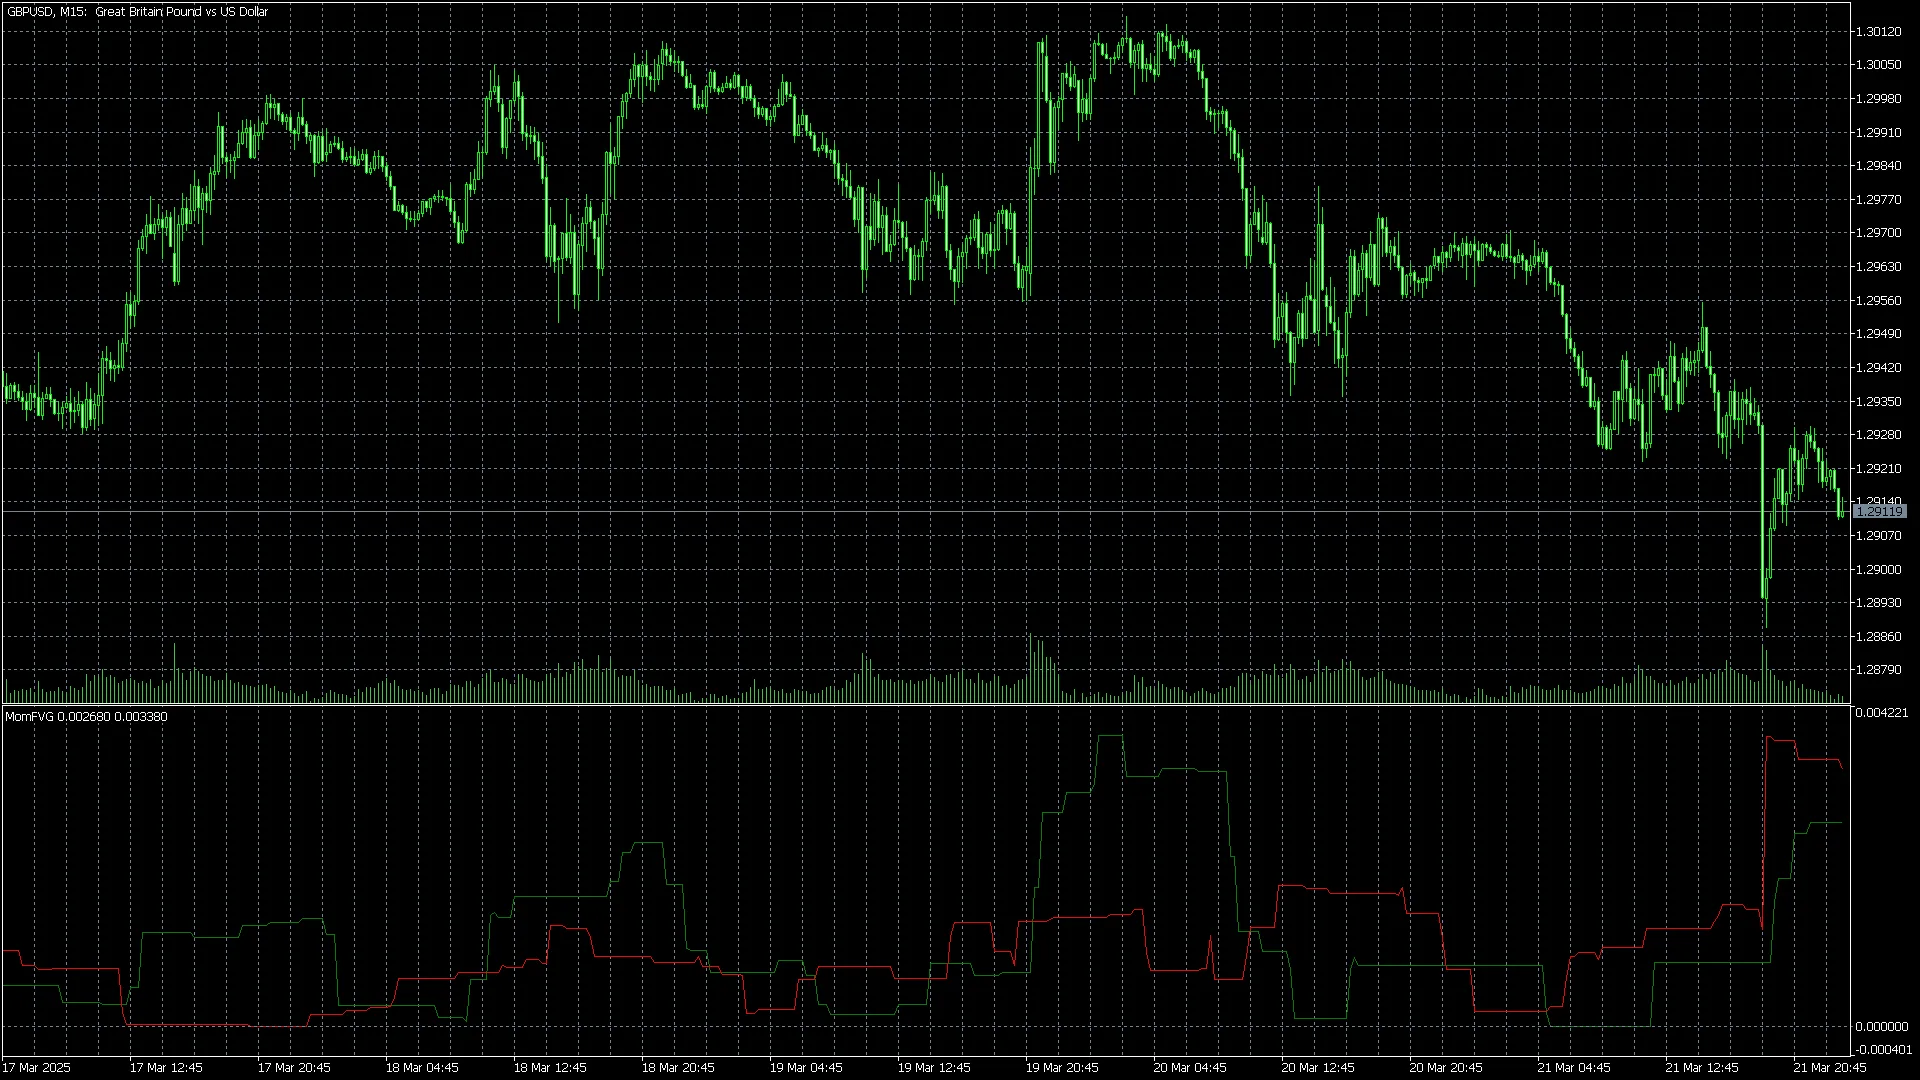
The Volume Oscillator is a powerful tool that traders can use to gauge market momentum, and it’s par...
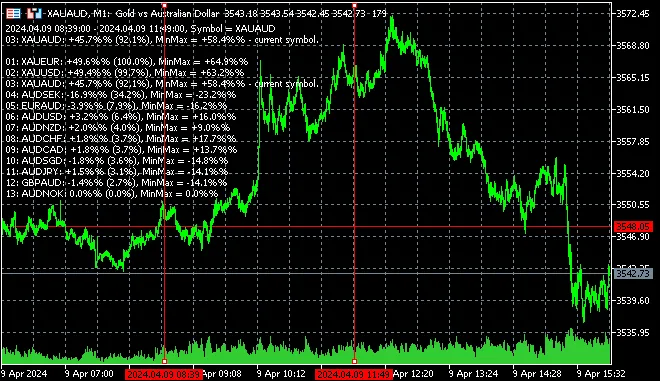
What’s It All About? Visual Benchmark of Your EAs’ Performance: Easily input the expected Historica...
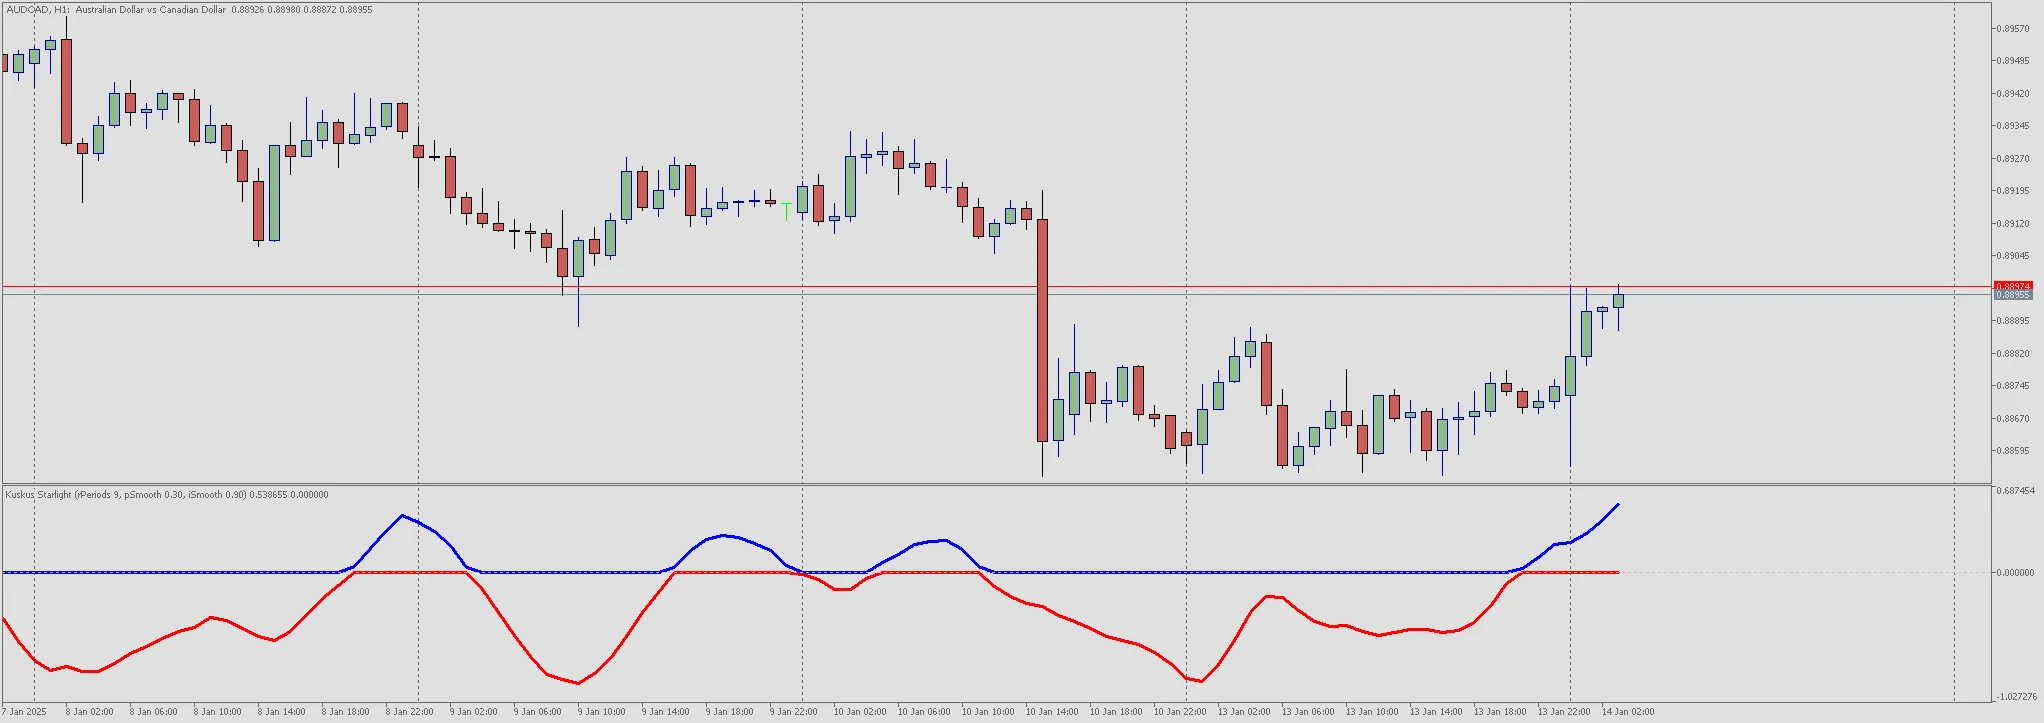
Indicator Name: Kuskus Starlight Description: Kuskus Starlight is a powerful technical indicator tha...
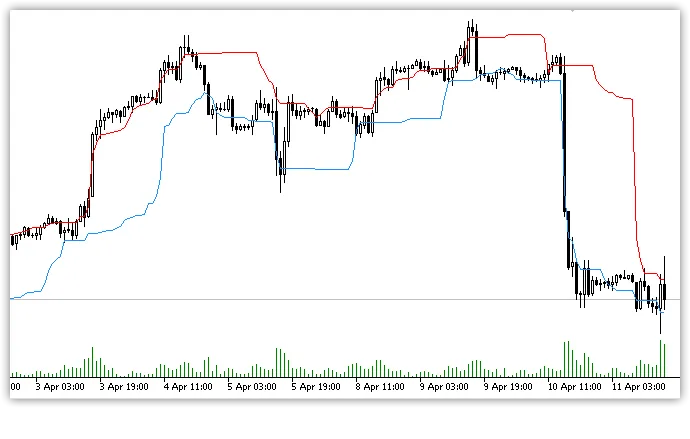
The Chande Kroll Stop indicator is a handy tool for setting your stop loss levels in trading. It cha...
Hey traders! Today, let’s dive into the Seconds Bars Indicator for MetaTrader 5. This nifty tool hel...
Hey traders! If you’re looking for a nifty tool to keep tabs on price movements in MetaTrader 5, you...
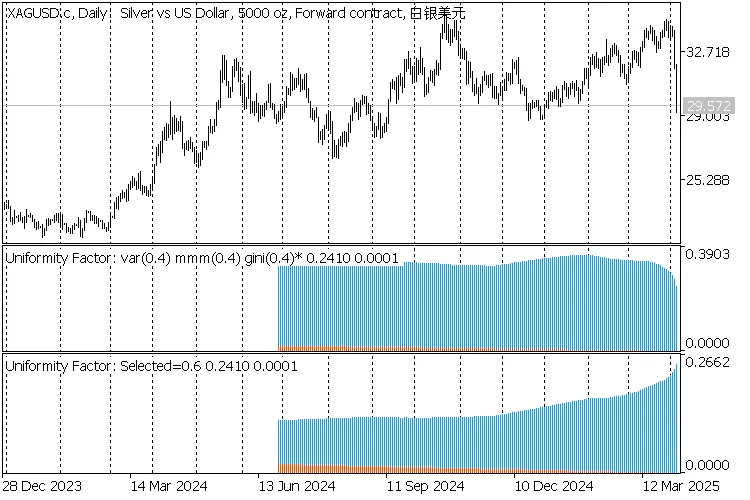
Hey fellow traders! Today, we're diving into the Uniformity Factor Indicator for MetaTrader 5. This ...
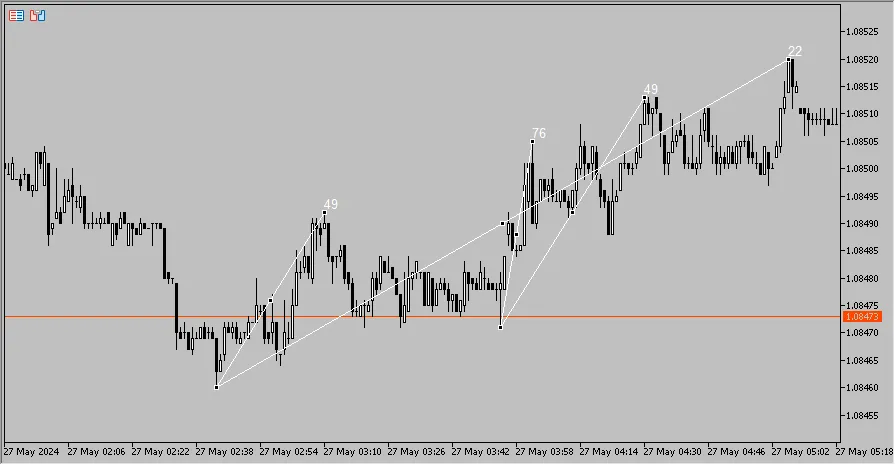
Hey traders! Today, we're diving into a unique tool called the Angle and Speed Indicator for MetaTra...
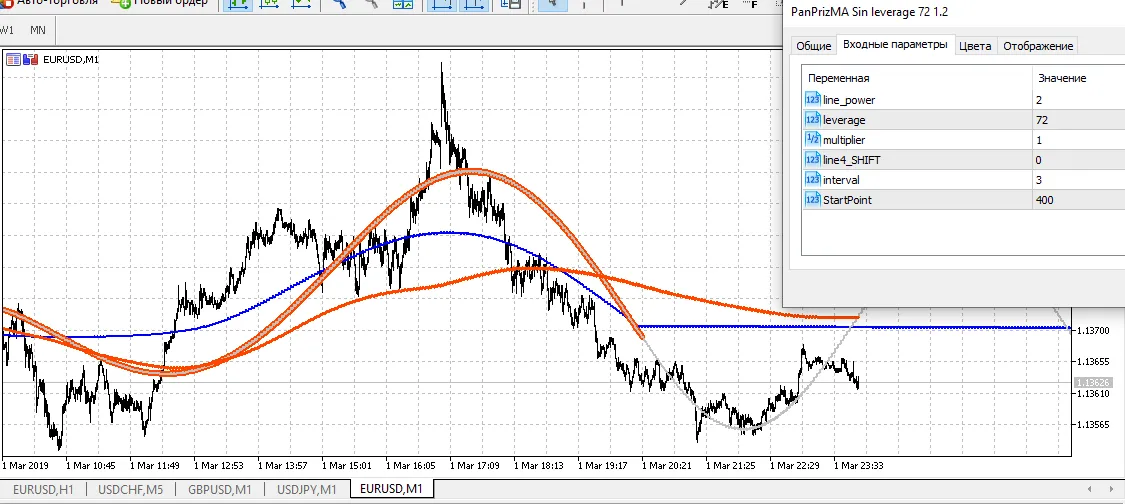
Welcome aboard, fellow traders! Today, we're diving into the Pan PrizMA No Leverage 72 indicator tai...
Unveiling the PSAR Zigzag Indicator If you’re familiar with the traditional zigzag indicator, you k...
If you're looking to navigate the tricky waters of a ranging market, I’ve got something exciting for...
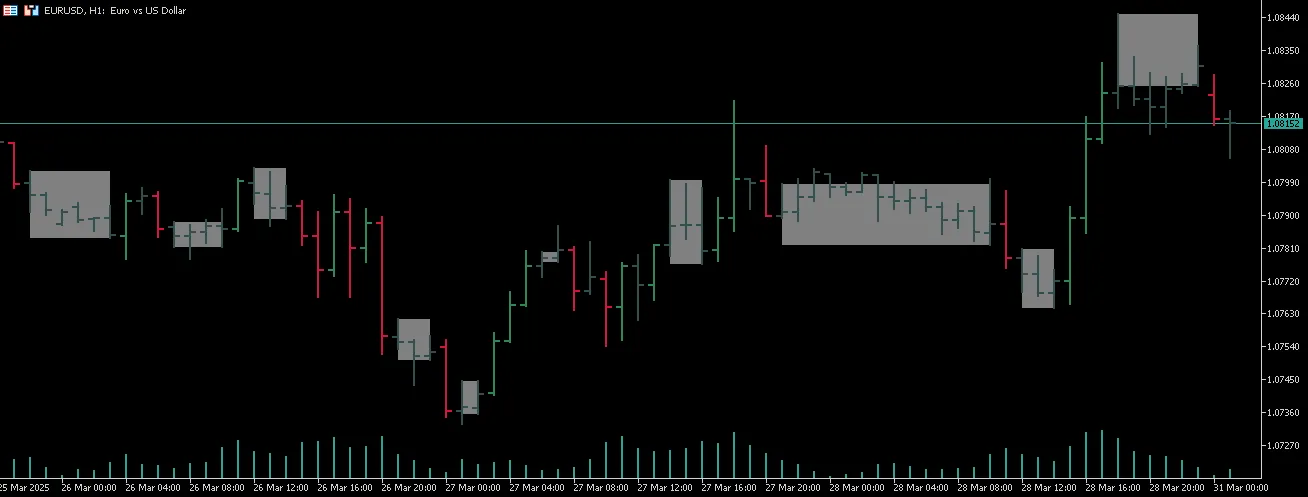
Hey traders! If you’re diving into the world of MetaTrader 5, you might have come across the FVG (Fa...
Hey there, fellow traders! Today, let’s dive into the Trend Zigzag indicator, a handy tool for those...
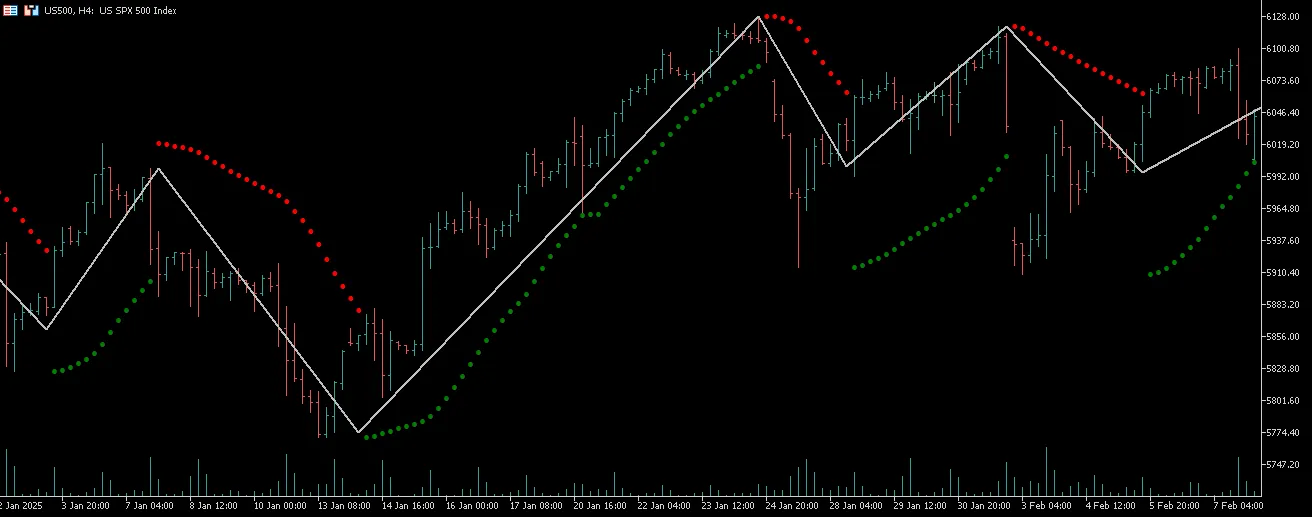
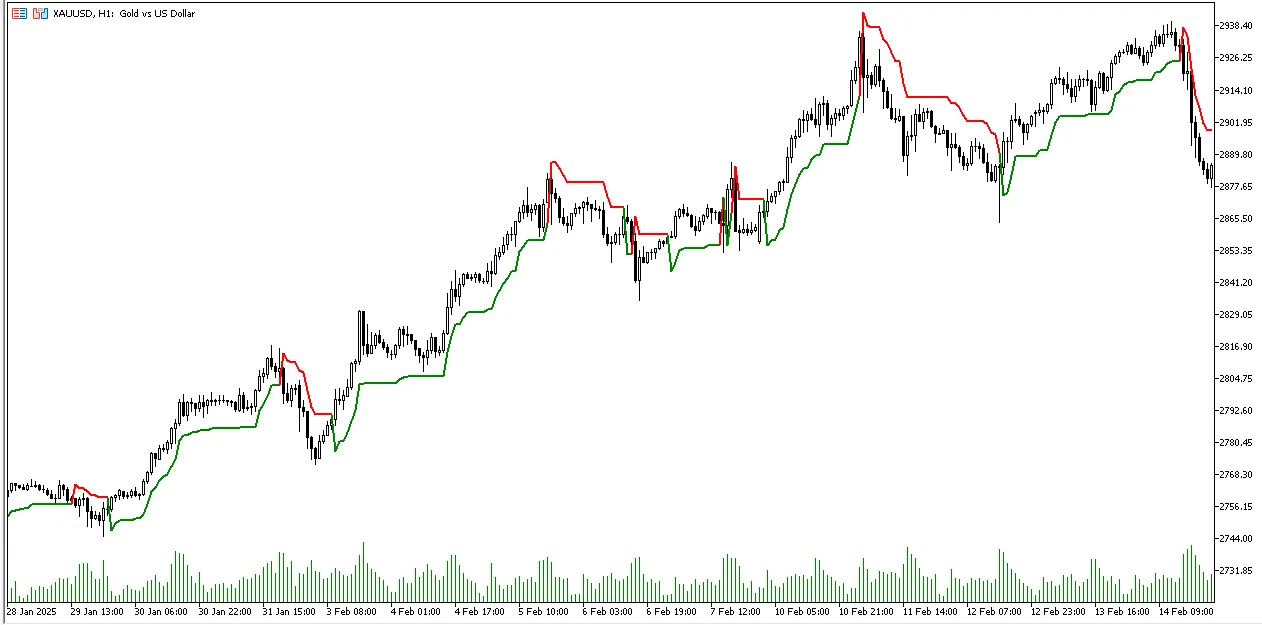
If you're looking to sharpen your trading edge, the SuperTrend indicator is a valuable tool to ...
If you're diving into the world of trading, you might want to get familiar with the BarDuration indi...
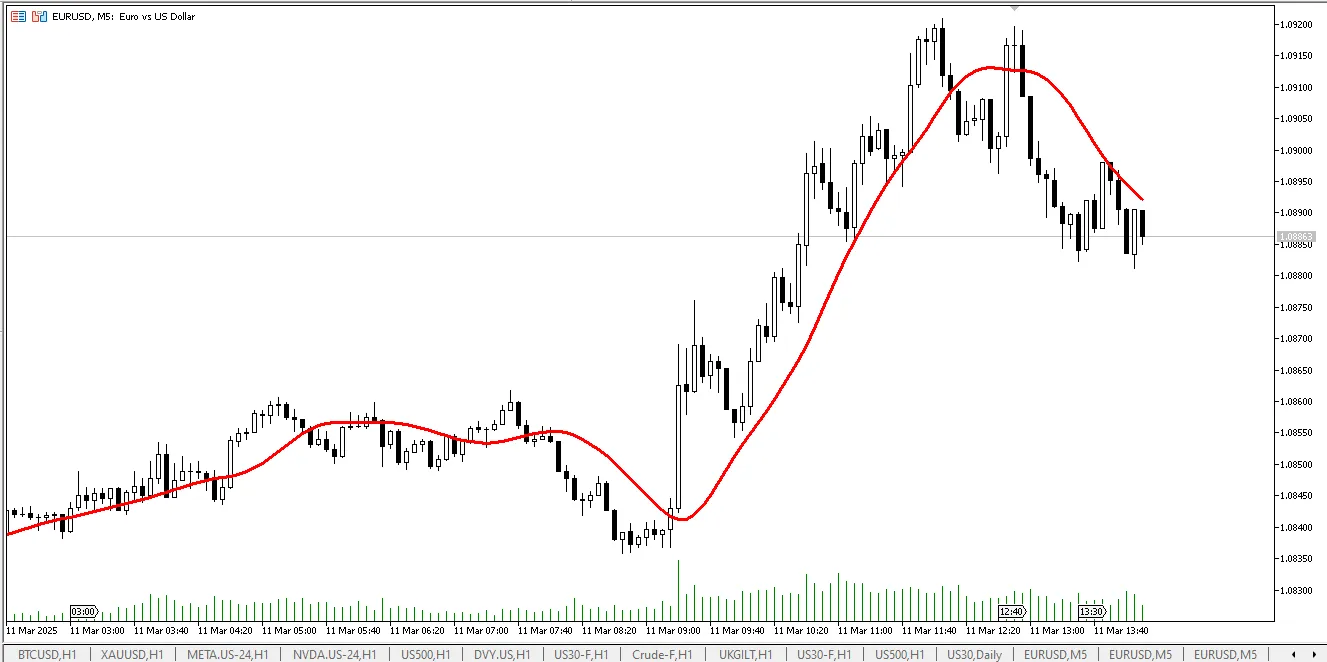
If you're looking to step up your trading game, the T3 Indicator is a powerful tool you won't want ...
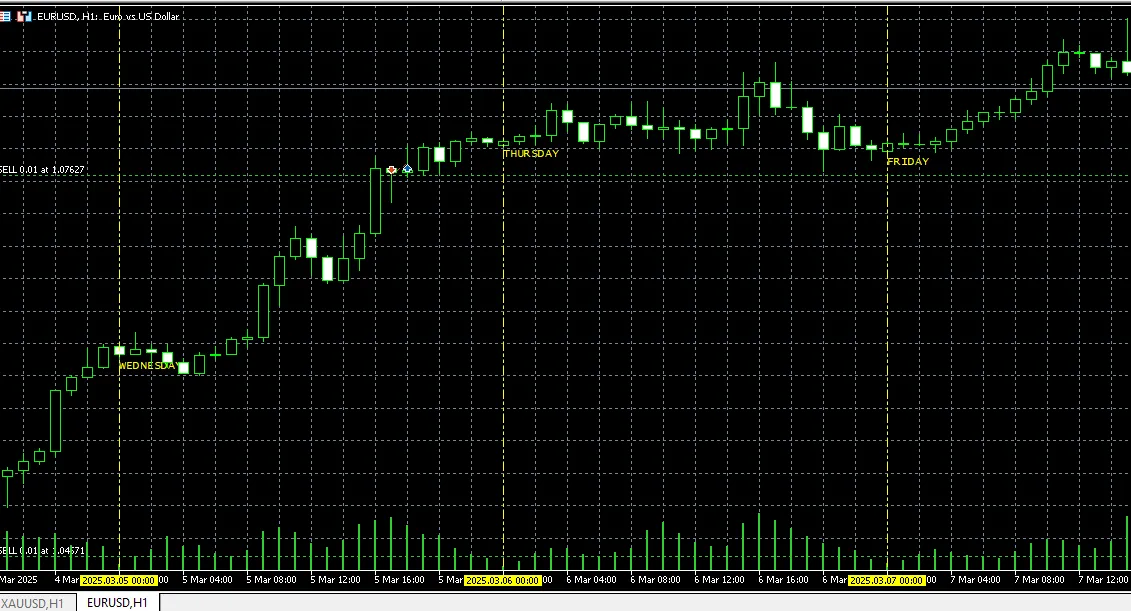
If you're looking for a straightforward way to track your trading days, the Daily Vertical Lines ind...
Getting Started with the Fibonacci ZigZag Indicator To set up the Fibonacci ZigZag indicator in Met...