MetaTrader4
Unlocking Trading Insights with the MA_Dash_Cobra Indicator
Welcome, fellow traders! Today, we’re diving into a powerful tool that can elevate your trading game – the MA_Dash_Cobra Indicator.
Understanding the MA_Dash_Cobra
The MA_Dash_Cobra is an innovative indicator designed to help you analyze market trends effectively. Here’s a quick breakdown of its key parameters:
MAPeriod=14;
MAMethod=0; // Options: 0-SMA, 1-EMA, 2-SMMA, 3-LWMA
MAPrice=0; // Options: 0-Close, 1-Open, 2-High, 3-Low, 4-Median, 5-Typical, 6-Weighted
How to Use the Indicator
Set your MAPeriod based on your trading strategy; 14 is a good starting point.
Choose the MAMethod that best suits your analysis – whether it’s a simple moving average or an exponential one.
Decide on the MAPrice type that aligns with your trading signals.
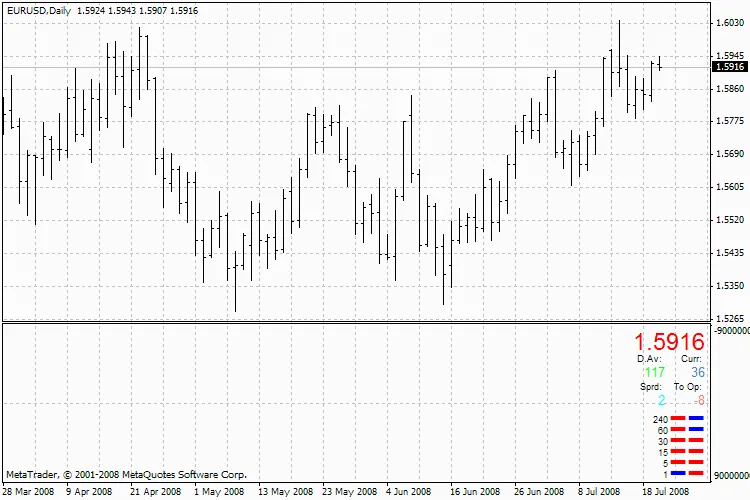
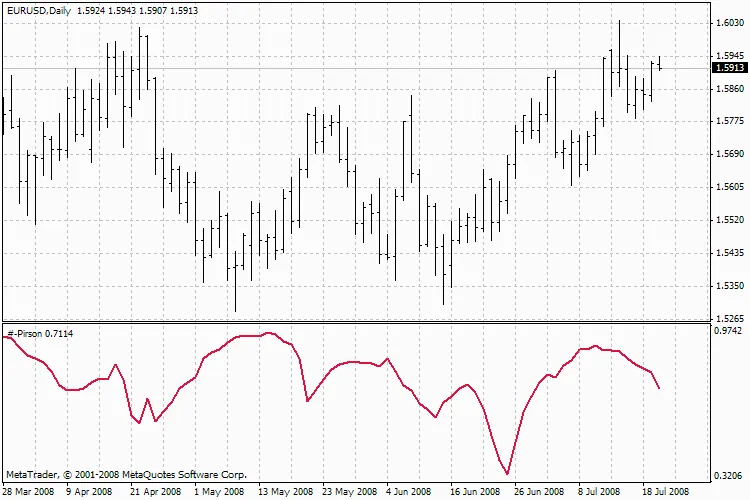
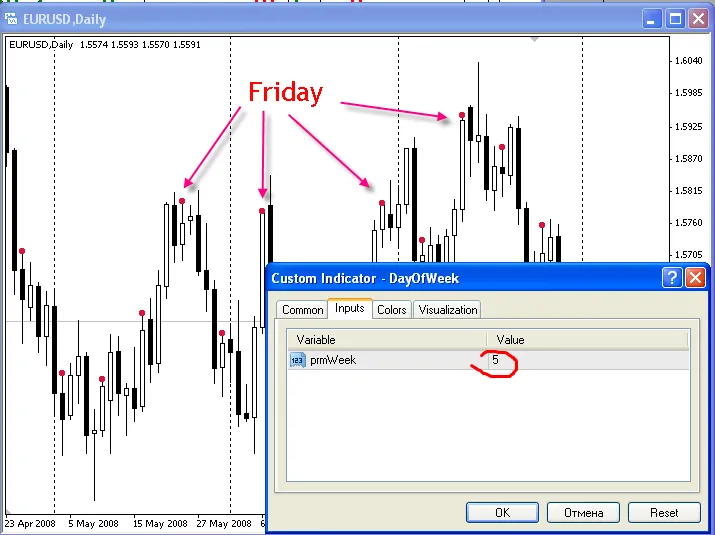
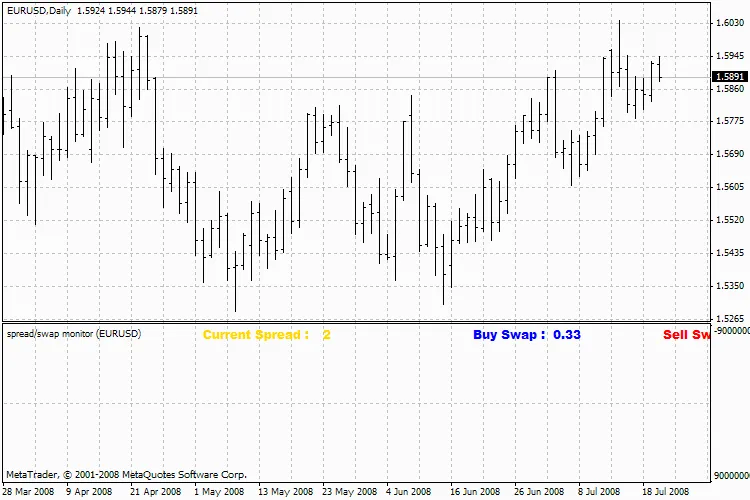
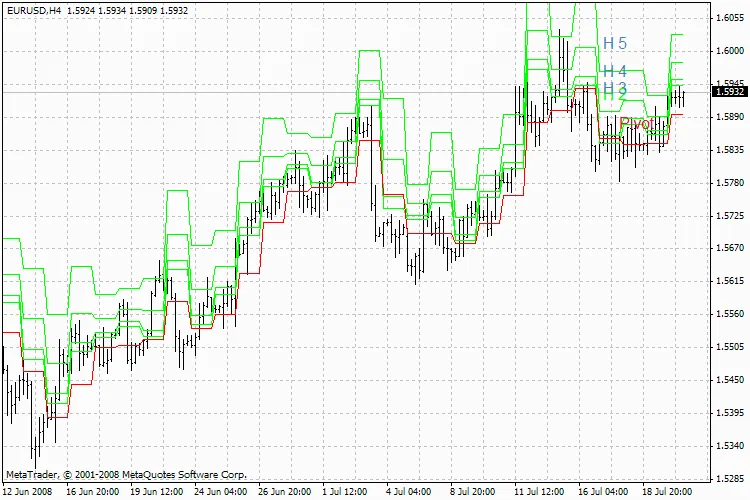
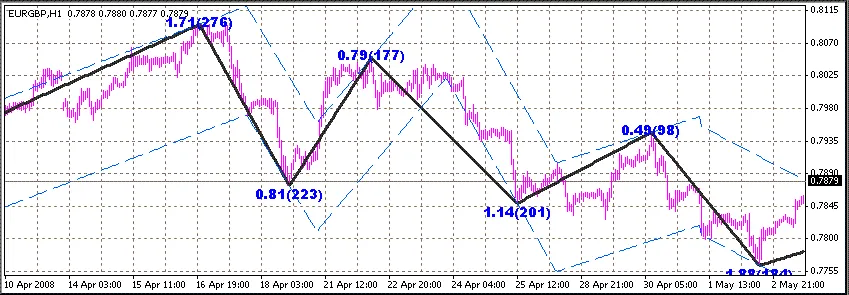
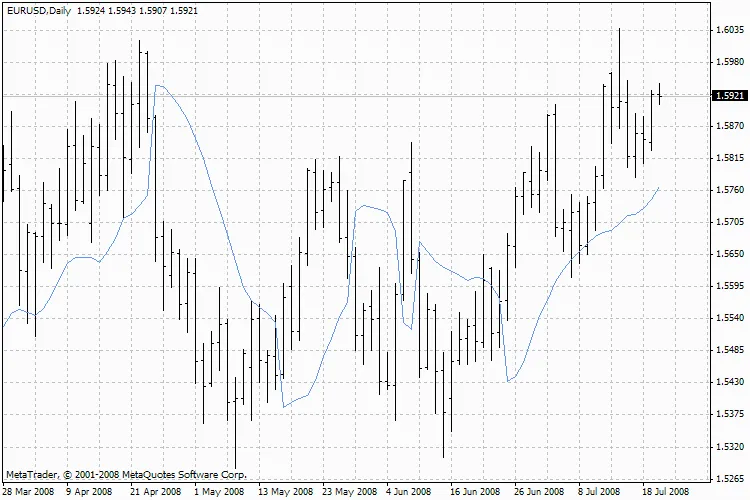
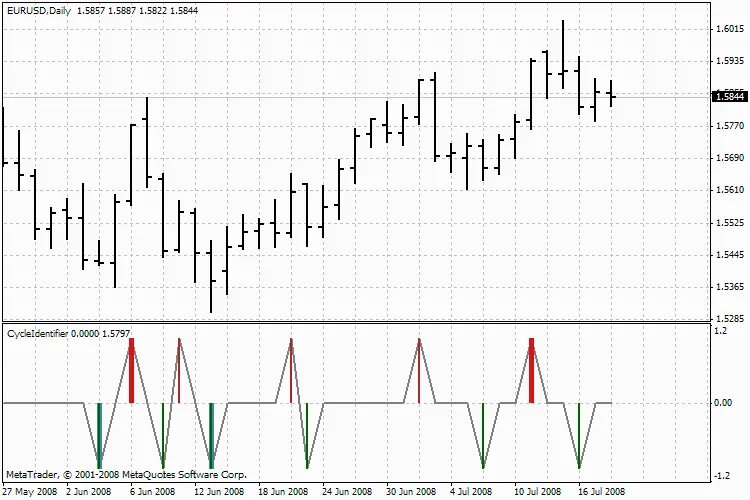
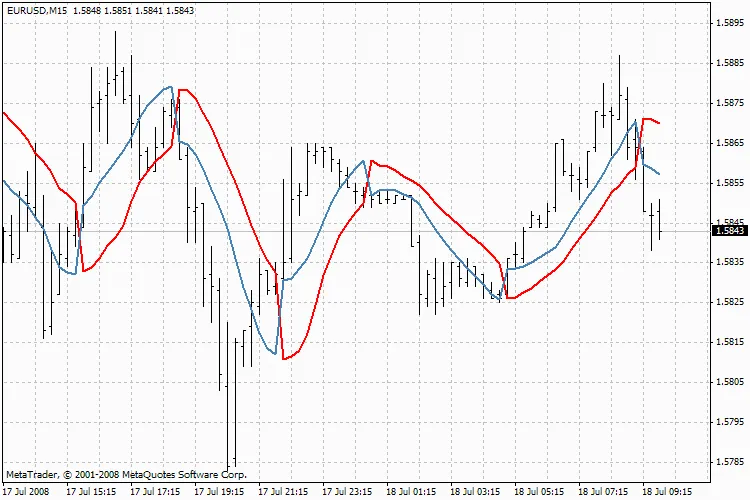
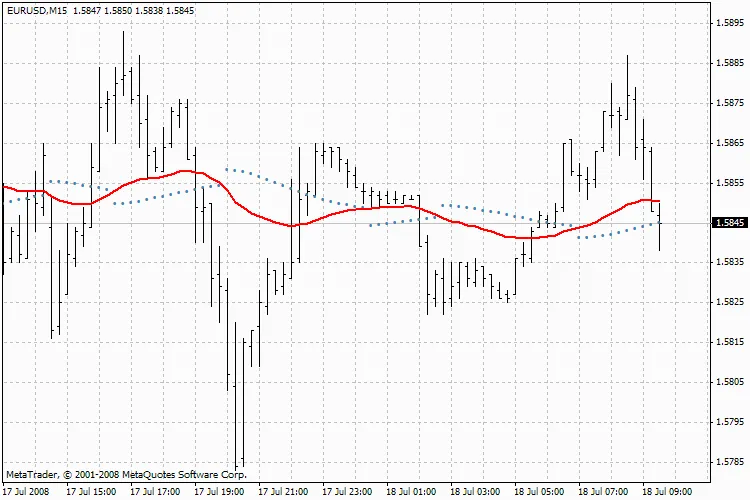
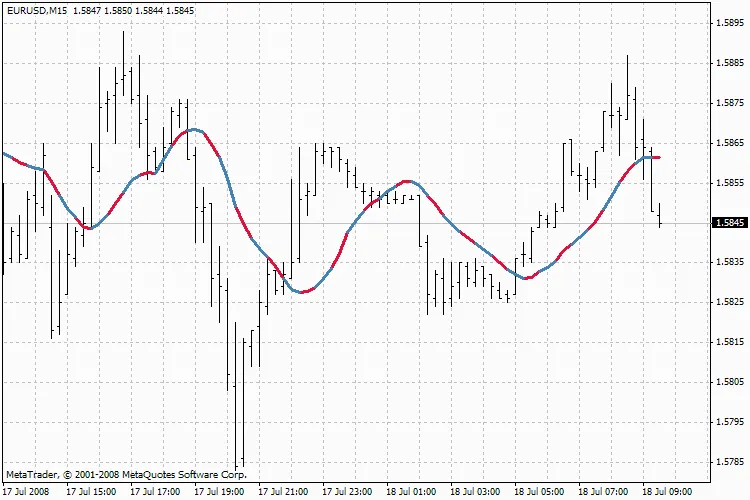
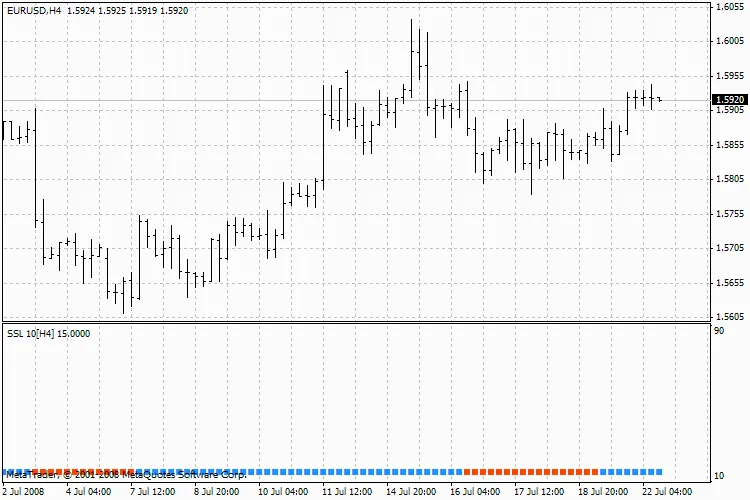
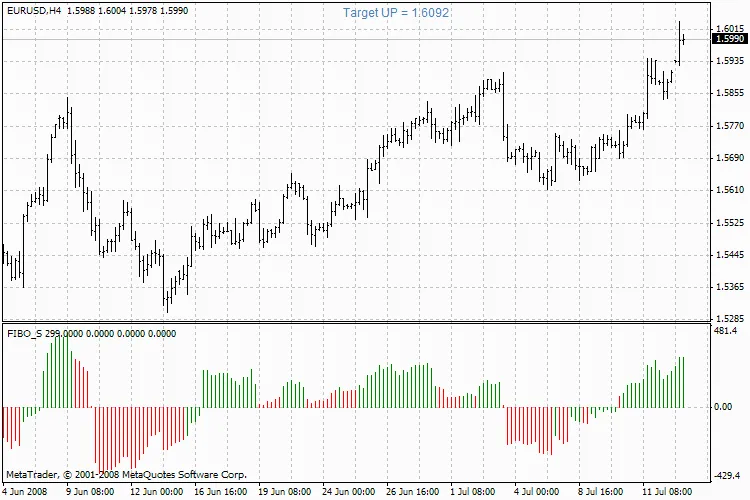
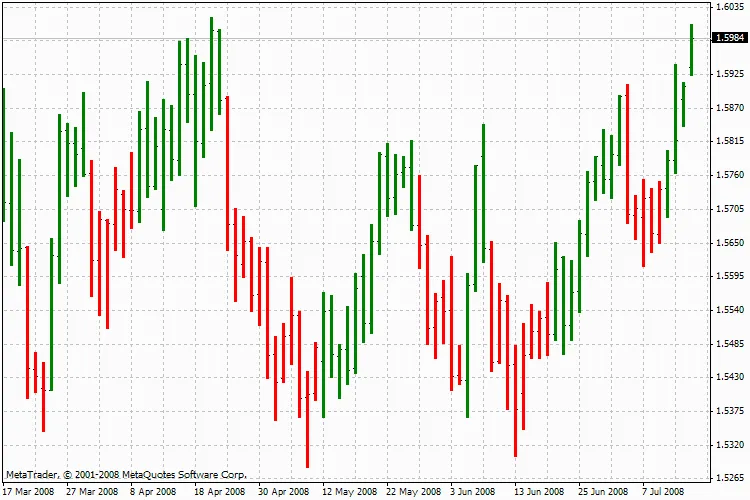
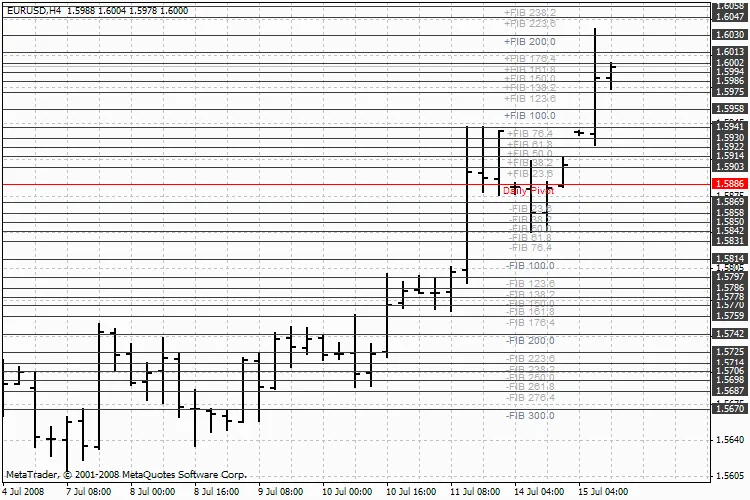
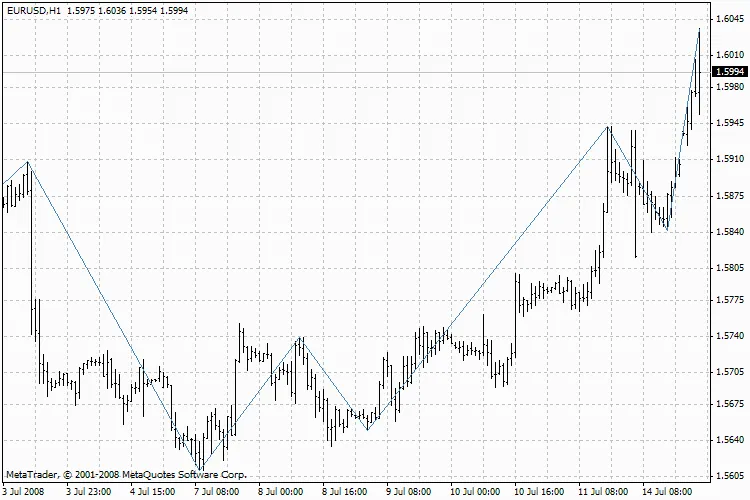
Visual representation of the MA_Dash_Cobra Indicator
Why Choose MA_Dash_Cobra?
This indicator is not just another tool in your trading kit; it’s a reliable companion that can help you make informed decisions. By understanding how to configure the parameters to your advantage, you can gain significant insights into market movements.
So, whether you’re a seasoned trader or just starting, integrating the MA_Dash_Cobra into your strategy can provide you with that extra edge you’re looking for. Happy trading!
2008.08.01