Technical Indicator

Understanding the Schaff Trend Indicator for Better Trading Decisions
MetaTrader4
Understanding the Schaff Trend Indicator for Better Trading Decisions

The Schaff Trend Indicator (STI) is a powerful tool that many traders utilize to enhance their trading strategies. If you’re looking to refine your approach and make more informed decisions, understanding how to use the Schaff Trend can be a game-changer. What is the Schaff Trend Indicator? The Schaff Trend Indicator is a blend of the moving average convergence divergence (MACD) and the classic stochastic indicator. It provides traders with signals about potential trend reversals and helps in identifying the strength of the current trend. Why Use the Schaff Trend Indicator? Trend Identification: STI helps traders quickly spot the prevailing market trends. Signal Accuracy: It offers reliable signals that are less prone to false alarms compared to other indicators. Versatility: Whether you're day trading or swing trading, STI can be adapted to fit your style. How to Implement the Schaff Trend in Your Trading Strategy To effectively incorporate the Schaff Trend Indicator into your trading plan, follow these steps: Set up the indicator on your trading platform. Look for crossovers: when the STI line crosses above a certain level, it may signal a buy opportunity, while crossing below could indicate a sell signal. Combine with other indicators for confirmation to improve your trade accuracy. In conclusion, the Schaff Trend Indicator is a valuable asset for traders looking to enhance their market analysis. By understanding its signals and integrating it into your trading routine, you can make more informed decisions and potentially increase your trading success.

2008.08.27
Understanding the NRTR Indicator: A Trader's Guide to Trend Following
MetaTrader4
Understanding the NRTR Indicator: A Trader's Guide to Trend Following

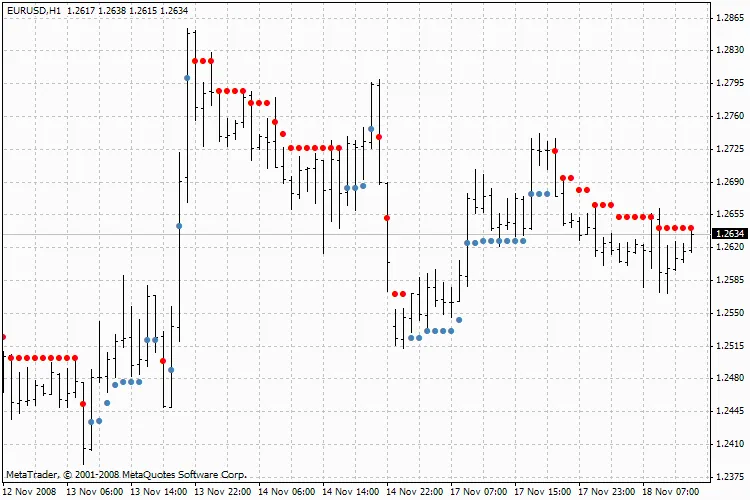
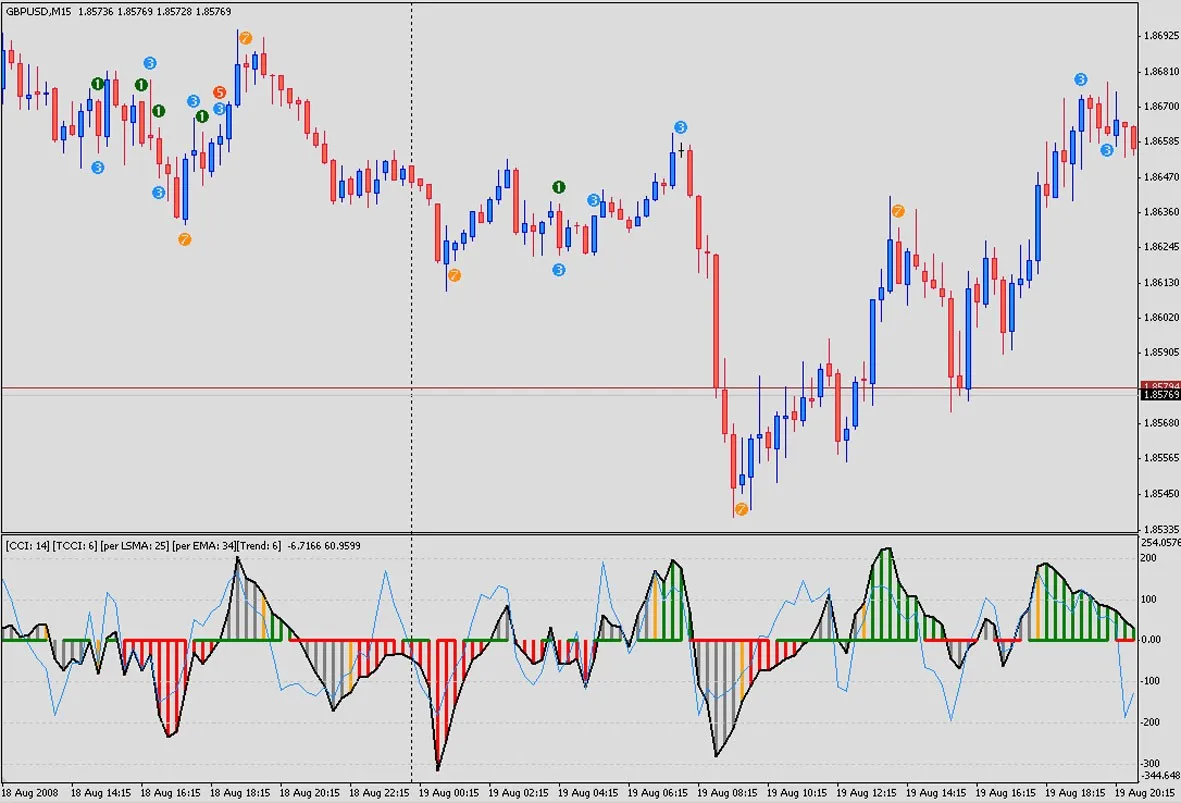
The NRTR, or Nick Rypock Trailing Reverse, is an intriguing tool for traders looking to capitalize on market trends. At its core, the NRTR keeps a set distance from the price extremes reached on the chart—it's positioned below the price levels during rising trends and above during falling ones. The underlying concept here is simple: while minor corrective movements against the main trend should be dismissed, significant movements that cross a certain threshold (defined by the moving filter K) indicate a potential trend reversal. This indicator operates using a dynamic price channel. It only considers prices from the current trend while excluding extremes from previous trends. The NRTR consistently maintains a specific percentage distance from these extremes, which helps traders identify potential entry and exit points effectively. How the NRTR is Calculated For rising trends, the NRTR formula is: NRTR = Highest(Close, period) * (1 - (K / 100)) And for falling trends, the formula changes to: NRTR = Lowest(Close, period) * (1 + (K / 100)) In these formulas, the first part identifies the highest or lowest price extremes reached during the last time the prices crossed the NRTR indicator. The variable K reflects the percentage distance from these extremes, acting as a moving filter. Like many trading indicators, the NRTR shines in trending markets but can become misleading in sideways or non-trending conditions. Therefore, it's essential to use it in conjunction with other analysis methods to enhance accuracy. If you’re looking to dive deeper into the properties and variations of the NRTR indicator, check out Konstantin Kopyrkin's detailed article on the subject. You can find it here: Trend Indicator of Breakthrough of the Dynamic Price Channel (Modern Trading, No. 4, 2001).

2008.08.27
Understanding AMA Bands: A Trader's Guide to Adaptive Moving Averages
MetaTrader4
Understanding AMA Bands: A Trader's Guide to Adaptive Moving Averages

What Are AMA Bands? In the world of trading, AMA Bands, or Adaptive Moving Average Bands, are a powerful tool that can enhance your trading strategy. The concept was brought to light by B. Shlossberg in his article on Bollinger Bands in Forex Magazine, July 2005. But what exactly are AMA Bands, and how can they help you in your trading journey? How AMA Bands Work AMA Bands are built on the foundation of the Adaptive Moving Average (AMA), which is derived from the output value of an adaptive integrator. This means that instead of recalculating all the historical data, AMA Bands only look at the most recent bars, specifically the last and the one before it. This can significantly reduce the computational load while still providing you with accurate signals. Interpreting the Signals The arrows you see on the chart represent trading signals. These signals are generated from the first derivative of the AMA, which helps you identify potential entry and exit points in the market. Essentially, these indicators help you stay ahead of the curve by highlighting trends before they become apparent in the price action. Why Use AMA Bands? Adaptability: AMA Bands adjust to changing market conditions, making them suitable for various trading styles. Simplicity: The reduced need for extensive calculations allows you to focus more on strategy rather than data crunching. Signal Clarity: The clear signals provided by the arrows enable quicker decision-making. Whether you're a seasoned trader or just starting out, understanding and incorporating AMA Bands into your trading toolkit can give you a competitive edge. Happy trading!

2008.08.23
First Previous 358 359 360 361 362 363 364 365 366 367 368 Next Last