Technical Indicator

Unlocking the X2MA NRTR Indicator for MetaTrader 5: A Trader's Guide
MetaTrader5
Unlocking the X2MA NRTR Indicator for MetaTrader 5: A Trader's Guide

The X2MA NRTR indicator is a powerful tool for traders using MetaTrader 5. It enhances moving average values by applying the NRTR algorithm, also known as Nick Rypock Trailing Reverse. This sophisticated approach helps in identifying potential trend reversals and supports your trading decisions. Notably, the GODZILLA EA, which clinched third place in the Automated Trading Championship 2006, is built on a breakout trading system that leverages the insights provided by this indicator. When using the X2MA NRTR, you have a selection of ten different smoothing algorithms to choose from: SMA - Simple Moving Average; EMA - Exponential Moving Average; SMMA - Smoothed Moving Average; LWMA - Linear Weighted Moving Average; JJMA - JMA Adaptive Average; JurX - Ultralinear Smoothing; ParMA - Parabolic Smoothing; T3 - Tillson's Multiple Exponential Smoothing; VIDYA - Smoothing with Tushar Chande's Algorithm; AMA - Smoothing with Perry Kaufman's Algorithm. It’s important to note that the Phase1 and Phase2 parameters vary in meaning depending on the smoothing algorithm you select. For example, in JJMA, it’s an external Phase variable that can range from -100 to +100. In contrast, for T3, it refers to a smoothing ratio multiplied by 100 for better visualization, while for VIDYA, it’s the CMO oscillator period, and for AMA, it’s the slow EMA period. In other algorithms, these parameters won’t affect smoothing. For AMA, the fast EMA period is fixed at a default value of 2, and the power ratio is also set to 2. To utilize the X2MA NRTR indicator effectively, you’ll need to include the SmoothAlgorithms.mqh library classes (make sure to copy it to the terminal_data_folder\MQL5\Include). A thorough explanation of these classes can be found in the article "Averaging Price Series for Intermediate Calculations Without Using Additional Buffers". Indicator Input Parameters: //+-----------------------------------+ //|  Indicator input parameters      | //+-----------------------------------+ input Smooth_Method MA_Method1=MODE_SMA;  // First smoothing averaging method input int Length1=12;                     // First smoothing depth                     input int Phase1=15;                      // First smoothing parameter //---- for JJMA Phase1 is changed at the range -100 ... +100 impacting transition process quality; //---- for VIDIA Phase1 is the CMO period, for AMA it is a period of the slow moving average input Smooth_Method MA_Method2=MODE_JJMA; // Second smoothing averaging method input int Length2= 5;                     // Second smoothing depth input int Phase2=15;                      // Second smoothing parameter //---- for JJMA Phase2 is changed at the range -100 ... +100 impacting transition process quality; //---- for VIDIA Phase2 is the CMO period, for AMA it is a period of the slow moving average input Applied_price_ IPC=PRICE_CLOSE;     // Price constant /* The indicator calculation is performed at that price (1-CLOSE, 2-OPEN, 3-HIGH, 4-LOW, 5-MEDIAN, 6-TYPICAL, 7-WEIGHTED, 8-SIMPLE, 9-QUARTER, 10-TRENDFOLLOW, 11-0.5 * TRENDFOLLOW.) */ input uint Step=30;                       // Flat oscillations size //---- this parameter determines the size of oscillations perceived as flat(discretization digital pitch in points) input uint Max_DEV=55;                    // Terminal deviation of price from X2MA that does not change the value of the average input int Shift=0;                        // Horizontal shift of the indicator in bars input int PriceShift=0                   // Vertical shift of the indicator in points

2011.11.24
Mastering the XXDPO Indicator for MetaTrader 5: Your Guide to Trading Signals
MetaTrader5
Mastering the XXDPO Indicator for MetaTrader 5: Your Guide to Trading Signals

Detrended Price Oscillator (DPO) is a handy technical indicator that helps traders identify when a market is overbought or oversold. It’s also great for generating buy and sell signals. The XXDPO focuses on the fundamental cycles of price movement by filtering out trends. Essentially, it smooths out the moving average into a line, allowing price changes above and below it to act as a trend oscillator. This indicator is particularly useful for pinpointing short-term cycles. By analyzing these short-term elements within longer-term cycles, traders can identify potential reversal points. The DPO doesn’t take long-term price cycles into account, making those short-term fluctuations stand out. Calculation: Here’s how to calculate the XXDPO: XXDPO = XMA(Price[bar] - XMA(Price[bar], SMOOTH_Period), DPO_Period)Where: XMA - the smoothing algorithm; Price[] - the current price of the asset; SMOOTH_Period - the period for smoothing the indicator; DPO_Period - the period for DPO smoothing; bar - the index of the bar. Understanding Trading Signals: When the DPO is above the zero line (meaning the price is above its moving average), it indicates a bullish signal. Conversely, if the DPO is below the zero line (the price is below its moving average), it signals a bearish trend. For spotting long-term cycle reversal points (divergences): If the chart forms a higher peak or a deeper trough, be on the lookout for a price reversal; If a peak or bottom is lower/higher than the last one, expect the price to drop. There are two interpretations for buy/sell signals: You should consider buying when: The DPO crosses the zero line upwards; The DPO is in the oversold area, confirmed by previous lows, and the upper channel line is being broken by both the DPO and the price, limiting any downward movement. You should think about selling when: The DPO crosses the zero line downwards; The DPO is in the overbought zone, confirmed by previous highs, and both the DPO and the price are breaking through the support line of an upward trend. Keep in mind that this indicator isn’t the go-to for trading signals on its own. It shines when used in conjunction with other indicators. Still, it’s a valuable tool for revealing cycles and determining the optimal width for other indicator windows. This indicator allows you to choose from ten different smoothing and averaging algorithms: SMA - simple moving average; EMA - exponential moving average; SMMA - smoothed moving average; LWMA - linear weighted moving average; JJMA - JMA adaptive average; JurX - ultralinear smoothing; ParMA - parabolic smoothing; T3 - Tillson's multiple exponential smoothing; VIDYA - smoothing using Tushar Chande's algorithm; AMA - smoothing with Perry Kaufman's algorithm. Note that the Phase1 and Phase2 parameters vary in meaning depending on the smoothing algorithm. For JMA, it’s an external Phase variable ranging from -100 to +100. For T3, it’s a smoothing ratio multiplied by 100 for better visualization. For VIDYA, it’s the CMO oscillator period, and for AMA, it’s a slow EMA period. In other algorithms, these parameters don’t affect smoothing. For AMA, the fast EMA period is a fixed value set at 2 by default, and the raising power ratio is also 2. The indicator uses classes from the SmoothAlgorithms.mqh library (which must be copied to the terminal_data_folder\MQL5\Include). You can find a detailed explanation of these classes in the article "Averaging Price Series for Intermediate Calculations Without Using Additional Buffers".

2011.11.23
Understanding the Cycle Period Indicator for MetaTrader 5
MetaTrader5
Understanding the Cycle Period Indicator for MetaTrader 5

Author: Witold Wozniak 
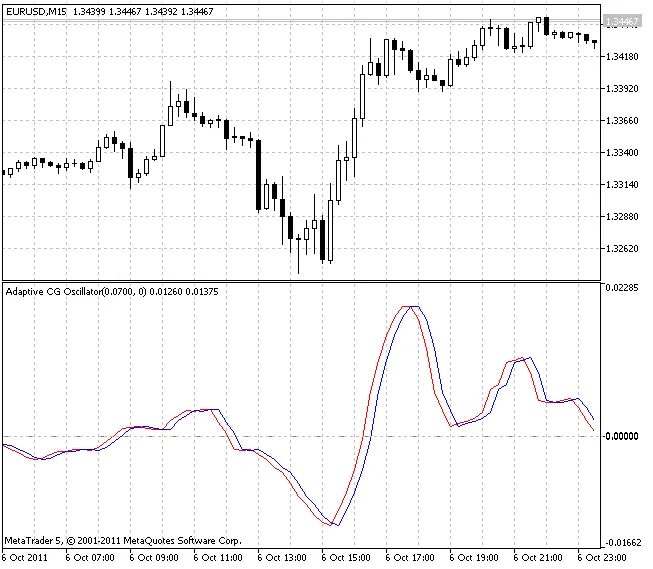
The Cycle Period indicator is a handy tool designed to measure the periodicity of price changes in financial assets. It keeps track of current market cycle values, which, as you might expect, are never really stable. This indicator works best when paired with oscillators, allowing them to adapt to the ever-changing market cycles. 
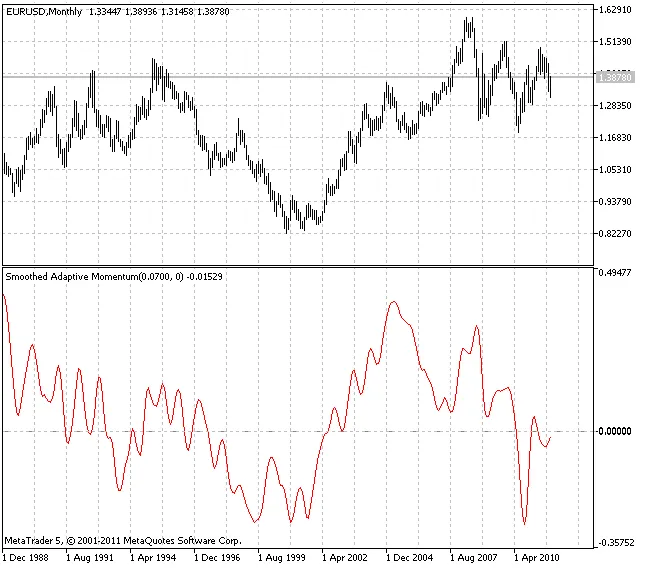
This concept is inspired by John Ehlers' insightful article "Using The Fisher Transform", published in November 2002 in the "Technical Analysis Of Stock & Commodities" magazine. To use the Cycle Period indicator, you'll need to declare its handle at a global level. This allows it to be utilized in other indicator codes, like the RVI oscillator: //---- Declaration of integer variables for the indicator handles int CP_Handle; Next, you need to retrieve the Cycle Period indicator handle in the initialization block of the RVI indicator: //---- Getting the Cycle Period indicator handle    CP_Handle=iCustom(NULL,0,"CyclePeriod", Alpha);    if(CP_Handle==INVALID_HANDLE)      {       Print("Failed to get the Cycle Period indicator handle");       return(1);      } Now, you have the new Alpha variable, which serves as the input parameter for the indicator and the smoothing ratio. This needs to be transformed into the input variable of the developed indicator: //+----------------------------------------------+ //| Indicator input parameters | //+----------------------------------------------+ input double Alpha=0.07; // Smoothing ratio You might want to remove the previous Length input variable from the input parameters list and change it to a local variable within the OnCalculate() function. This is because the size of the arrays used for smoothing is determined by the Length parameter: //---- Memory allocation for the variable arrays    ArrayResize(Count, Length);    ArrayResize(Value1, Length);    ArrayResize(Value2, Length); Since this parameter's value is changing, it’s wise to set the array sizes to a value that won’t be less than the maximum expected for this variable. Typically, we find that this value doesn’t exceed 100, so you can set the array sizes like this: //---- Memory distribution for the variable arrays    ArrayResize(Count, MAXPERIOD);    ArrayResize(Value1, MAXPERIOD);    ArrayResize(Value2, MAXPERIOD); Finally, in the OnCalculate() block, you'll need to retrieve the period values for the current bar from the Cycle Period custom indicator buffer. This allows you to use them instead of the former Length input parameter: //---- Main indicator calculation loop    for(bar=first; bar<rates_total && !IsStopped(); bar++)      {       //---- Copy newly appeared data into the array          if(CopyBuffer(CP_Handle,0,rates_total-1-bar,4,period)<=0) return(RESET);          Length=int(MathFloor((4.0*period[0]+3.0*period[1]+2.0*period[2]+period[3])/20.0));          if(bar<Length) Length=bar; // Adjusting the smoothing to the actual number of bars In this case, the last four values are taken from the Cycle Period indicator buffer, and their linearly weighted smoothing is applied. The resulting value is used as the Length smoothing period. Lastly, make sure to modify the ending line of the indicator code:       if(bar<rates_total-1) Recount_ArrayZeroPos(Count, MAXPERIOD); And there you have it! You've successfully created an Adaptive RVI oscillator:

2011.11.23
Mastering Daily Range Projections for MetaTrader 5
MetaTrader5
Mastering Daily Range Projections for MetaTrader 5

Have you ever wanted to predict the high and low price values of an asset for the current trading day? The Daily Range Projections indicator for MetaTrader 5 is here to help, using the candlestick patterns from yesterday and today to give you a clearer picture of potential price movements.So, how does it work? Tomorrow's price range (let's call it X) is determined by the ratio of today’s closing and opening prices. There are three scenarios to consider:1. If Close[0] < Open[0], then X = (High[1] + Low[1] + Close[1] + Low[1]) / 2;2. If Close[0] > Open[0], then X = (High[1] + Low[1] + Close[1] + High[1]) / 2;3. If Close[0] = Open[0], then X = (High[1] + Low[1] + Close[1] + Close[1]) / 2.Here’s a quick breakdown of the terms:Open[0], High[0], Low[0], Close[0] - these represent the current day’s prices;Open[1], High[1], Low[1], Close[1] - these are yesterday’s prices.Now, to estimate tomorrow's price range, you can calculate the potential low price with Min = X - High[1] and the potential high price with Max = Low[1] - X.This version of the Daily Range Projections indicator can be applied to any chart bar, giving you a comprehensive view of market behavior relative to the indicator levels at each bar. A great use case for this tool is during offline strategy analysis, helping you refine your trading tactics.The indicator is inspired by the book "Forex from the First Person: For Beginners and Professionals" (by A. Vedikhin, G. Petrov, B. Shylov).

2011.11.22
First Previous 250 251 252 253 254 255 256 257 258 259 260 Next Last