Technical Indicator

Maximize Your Trading Edge with the Ultra Spearman Rank Correlation Indicator for MetaTrader 5
MetaTrader5
Maximize Your Trading Edge with the Ultra Spearman Rank Correlation Indicator for MetaTrader 5

If you’re looking to enhance your trading strategy, the Ultra Spearman Rank Correlation indicator for MetaTrader 5 could be just what you need. Built on the principles of the Spearman Rank Correlation, this indicator offers a unique approach to analyzing market trends. Let's dive into how this tool works and how you can leverage it for your trading success. How Does It Work? The Ultra Spearman Rank Correlation indicator operates by calculating various signal lines based on specific input parameters. Here’s a quick rundown: rangeN: This defines the averaging period you’ll be working with. The calculation formula for these signal lines follows an arithmetic progression: SignalPeriod(Number) = StartLength + Number * Step In this formula, the Number variable ranges from 0 to StepsTotal. The resulting periods are compiled into arrays and used to calculate the average values of the Spearman Rank Correlation indicator. The direction of the current trend is determined by these averaged trend values across all signal lines. The final output presents positive and negative trend values averaged into indicator lines, visualized as a color histogram. The histogram's color reflects the trend direction, while its width illustrates the trend's strength. When indicator values fall outside the overbought and oversold thresholds, dark colors are displayed. Conversely, light colors indicate overbought or oversold conditions. Input Parameters Here’s a look at the input parameters you can customize: input int rangeN = 14; input Smooth_Method W_Method = MODE_JJMA; // Smoothing method input int StartLength = 3; // Starting length input int WPhase = 100; // Phase input uint Step = 5; // Period step input uint StepsTotal = 10; // Total steps input Smooth_Method SmoothMethod = MODE_JJMA; // Smoothing method input int SmoothLength = 3; // Smoothing length input int SmoothPhase = 100; // Smoothing phase input uint UpLevel = 80; // Overbought level (%) input uint DnLevel = 20; // Oversold level (%) input color UpLevelsColor = Blue; // Overbought color input color DnLevelsColor = Blue; // Oversold color input STYLE Levelstyle = DASH_; // Level style input WIDTH LevelsWidth = Width_1; // Level width You have the flexibility to choose from various smoothing methods: SMA - Simple Moving Average EMA - Exponential Moving Average SMMA - Smoothed Moving Average LWMA - Linear Weighted Moving Average JJMA - JMA Adaptive Average JurX - Ultralinear Smoothing ParMA - Parabolic Smoothing T3 - Tillson's Multiple Exponential Smoothing VIDYA - Smoothing with Tushar Chande's Algorithm AMA - Smoothing with Perry Kaufman's Algorithm It’s important to note that the Phase1 and Phase2 parameters have different implications across various smoothing algorithms. For instance, with JMA, Phase is an external variable ranging from -100 to +100, while for T3, it represents a smoothing ratio multiplied by 100 for better visualization. Make sure you're familiar with these nuances when using the indicator. To get started, you’ll need to include the SmoothAlgorithms.mqh library classes in your terminal_data_folder\MQL5\Include. For a thorough guide on how to use these classes, check out the article "Averaging Price Series for Intermediate Calculations Without Using Additional Buffers". You’ll also need to ensure that the SpearmanRankCorrelation.mq5 indicator is placed in the terminal_data_folder\MQL5\Include. Ultra Spearman Rank Correlation Indicator

2012.02.08
Unlocking Trend Analysis with the ColorStdDev Indicator for MetaTrader 5
MetaTrader5
Unlocking Trend Analysis with the ColorStdDev Indicator for MetaTrader 5

If you're looking to sharpen your trend analysis skills, the ColorStdDev Indicator for MetaTrader 5 is a game changer. This handy tool uses Standard Deviation data to give you a clear visual representation of trend strength. With this indicator, you'll see values displayed in points, which are then compared to three key levels: MaxTrendLevel, MiddLeTrendLevel, and FlatLevel. These levels are customizable input parameters that you can tailor to fit your trading style. The histogram bars can be color-coded in four different shades based on these comparisons, making it easy to spot where the market stands at a glance. Setting Up the ColorStdDev Indicator Before diving in, here’s a quick rundown of the input parameters you can adjust: //+-----------------------------------+ //| Indicator input parameters       | //+-----------------------------------+ input int period = 12;                            // Smoothing period input ENUM_MA_METHOD MA_Method=MODE_EMA;            // Histogram smoothing method input ENUM_APPLIED_PRICE  applied_price=PRICE_CLOSE; // Applied price input int MaxTrendLevel=100;                      // Maximum trend level input int MiddLeTrendLevel=40;                    // Middle trend level input int FlatLevel=10;                           // Flat level By adjusting these parameters to your trading strategy, you can maximize the effectiveness of the ColorStdDev indicator. So, give it a spin, and watch your market analysis elevate to new heights!

2012.02.07
Mastering the XR-Squared Indicator for MetaTrader 5: Your Ultimate Guide
MetaTrader5
Mastering the XR-Squared Indicator for MetaTrader 5: Your Ultimate Guide

The XR-Squared indicator is a powerful tool that leverages linear regression to help you spot market trends. If you're looking to refine your trading strategy, this is one indicator you won't want to overlook. On your chart, you’ll see the XR-Squared line along with two key levels that indicate trending and flat market conditions. The indicator values range from 0 to 100. When the XR-Squared dips below 30, it signals a flat market. Conversely, values above 70 indicate a trend is in play. As trends develop, the XR-Squared line climbs from the flat zone into trending territory. Keep an eye on it, as when the market hits a peak and begins to retrace, the indicator will typically drop again. A higher XR-Squared value suggests that a new trend is statistically significant. It's worth noting that the critical power level of a trend can decrease depending on the timeframe you're analyzing. Input Parameters: //+-----------------------------------+ //| Indicator input parameters | //+-----------------------------------+ input int XPeriod=14;                   // Indicator period input Smooth_Method RMethod=MODE_JJMA; // Smoothing method input int RPeriod=3;                    // Smoothing period input int RPhase=100;                   // Smoothing parameter input Smooth_Method SignMethod=MODE_SMA; // Smoothing method input int SignPeriod=14;                 // Signal line smoothing period input int SignPhase=15;                  // Smoothing parameter input Applied_price_ IPC=PRICE_CLOSE;    // Applied price input int Shift=0;                       // Horizontal shift of the indicator in bars This indicator also allows you to modify the smoothing method. You have various options to choose from: SMA - Simple Moving Average; EMA - Exponential Moving Average; SMMA - Smoothed Moving Average; LWMA - Linear Weighted Moving Average; JJMA - JMA Adaptive Average; JurX - Ultralinear Smoothing; ParMA - Parabolic Smoothing; T3 - Tillson's Multiple Exponential Smoothing; VIDYA - Smoothing using Tushar Chande's Algorithm; AMA - Smoothing using Perry Kaufman's Algorithm. Keep in mind that the phase parameters for different smoothing methods have unique meanings. For example, in JMA, the phase variable ranges from -100 to +100. For T3, it represents a smoothing ratio for better visualization, while for VIDYA, it indicates the CMO oscillator period. For AMA, the fast EMA period is set at a fixed value of 2 by default, and the raising power ratio is also set to 2. This indicator utilizes the SmoothAlgorithms.mqh library classes, which you’ll need to copy to your terminal_data_folder\MQL5\Include. You can find a detailed explanation of these classes in the article "Averaging Price Series for Intermediate Calculations Without Using Additional Buffers".

2012.02.07
Unlocking the UltraFatl Indicator for MetaTrader 5: A Trader's Guide
MetaTrader5
Unlocking the UltraFatl Indicator for MetaTrader 5: A Trader's Guide

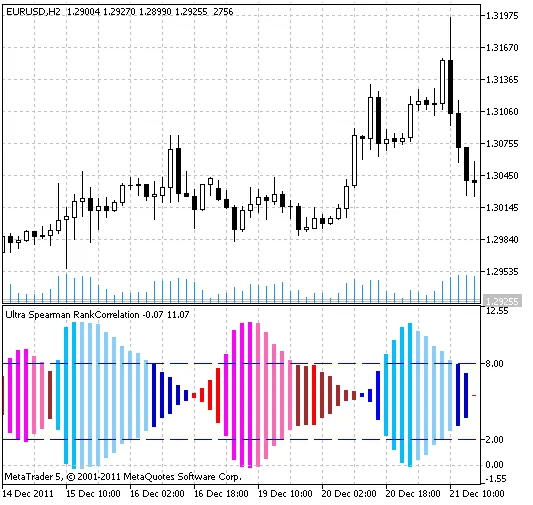
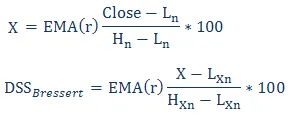
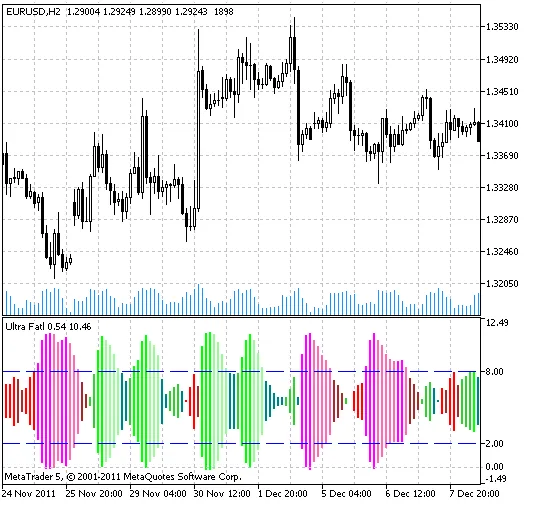
Hey there, fellow traders! Today, we're diving into the UltraFatl indicator, a powerful tool for MetaTrader 5 that’s designed to help you make sense of market trends. This indicator takes the Fatl indicator values and analyzes its signal lines to provide a clearer picture of the market. So, how does it work? The calculation of the signal lines follows a straightforward algorithm. Each signal line's period is determined using the arithmetic progression formula: SignalPeriod(Number) = StartLength + Number * Step Here, the Number variable ranges from 0 to StepsTotal. The indicator utilizes Fatl indicators with various periods to calculate average values, which helps in determining the current trend direction based on these averaged values. The beauty of the UltraFatl lies in its visualization. The positive and negative trend values are averaged and presented as indicator lines, displayed as a color histogram. This histogram is plotted using the DRAW_COLOR_HISTOGRAM2 style. The color of the histogram indicates the trend direction, while its width reflects the strength of that trend. For clarity, the histogram uses four colors for different trend directions. Dark colors represent values beyond the overbought and oversold levels, while lighter shades indicate when the market is in those zones. Indicator Input Parameters: //+----------------------------------------------+ //| Indicator input parameters                   | //+----------------------------------------------+ input ENUM_APPLIED_PRICE Applied_price=PRICE_CLOSE; // Applied price //---- input Smooth_Method W_Method=MODE_JJMA;        // Smoothing method input int StartLength=3;                       // Initial smoothing period input int WPhase=100                          // Phase //----   input uint Step=5                              // Step input uint StepsTotal=10                       // Total steps //---- input Smooth_Method SmoothMethod=MODE_JJMA;    // Smoothing method input int SmoothLength=3;                       // Smoothing length input int SmoothPhase=100                      // Phase input Applied_price_ IPC=PRICE_CLOSE_;         // Applied price //----                           input uint UpLevel=80                          // Overbought level (in %) input uint DnLevel=20                         // Oversold level (in %) input color UpLevelsColor=Blue;                 // Color of overbought level input color DnLevelsColor=Blue;                // Color of oversold level input STYLE Levelstyle=DASH_;                  // Level style input WIDTH  LevelsWidth=Width_1;              // Level widthOne of the cool features of this indicator is the variety of smoothing methods it offers. Here are some options: SMA - Simple Moving Average; EMA - Exponential Moving Average; SMMA - Smoothed Moving Average; LWMA - Linear Weighted Moving Average; JJMA - JMA Adaptive Average; JurX - Ultralinear Smoothing; ParMA - Parabolic Smoothing; T3 - Tillson's Multiple Exponential Smoothing; VIDYA - Smoothing with Tushar Chande's Algorithm; AMA - Smoothing with Perry Kaufman's Algorithm. Keep in mind that the Phase1 and Phase2 parameters have different meanings depending on the smoothing algorithm you choose. For instance, with JMA, it refers to an external Phase variable that ranges from -100 to +100. In contrast, for T3, it functions as a smoothing ratio. Each algorithm is unique, so read up on how they affect your settings. Lastly, the UltraFatl utilizes the SmoothAlgorithms.mqh library classes. Make sure you copy these to your terminal_data_folder/MQL5/Include. For an in-depth understanding of how these classes work, check out the article titled "Averaging Price Series for Intermediate Calculations Without Using Additional Buffers". UltraFatl Indicator

2012.02.07
Unlock Trading Potential with TrendManager for MetaTrader 5
MetaTrader5
Unlock Trading Potential with TrendManager for MetaTrader 5

Meet the Creator: Alejandro Galindo Introducing the TrendManager, a visual trend indicator designed to help you gauge the direction and strength of current price movements in your trading endeavors. Key Features of the TrendManager Indicator Direction & Power: Instantly see where the market is headed and how strong that movement is. User-Friendly: Easy to set up and integrate into your existing MetaTrader 5 platform. Customizable Parameters: Tailor the indicator to fit your trading style. Input Parameters for TrendManager Here’s a breakdown of the key input parameters you can customize: //+-----------------------------------+ //| Indicator Input Parameters | //+-----------------------------------+ input uint DVLimit=70;                       // Limit in points input uint Fast_Period=23;                   // Fast MA period input ENUM_APPLIED_PRICE Fast_Price=PRICE_OPEN; // Fast MA price type input ENUM_MA_METHOD Fast_Method=MODE_SMA;     // Fast MA smoothing method input uint Slow_Period=84;                   // Slow MA period input ENUM_APPLIED_PRICE Slow_Price=PRICE_OPEN; // Slow MA price type input ENUM_MA_METHOD Slow_Method=MODE_SMA;     // Slow MA smoothing method input int  Shift=0;                          // Horizontal shift of the indicator in bars If you're looking to enhance your trading strategy, the TrendManager indicator could be your new best friend. Give it a try and see how it can elevate your trading game!

2012.02.07
Mastering the Sidus Indicator for MetaTrader 5: A Trader's Guide
MetaTrader5
Mastering the Sidus Indicator for MetaTrader 5: A Trader's Guide

Author: GwadaTradeBoy The Sidus Indicator is rooted in the classic Sidus trading method, designed to pinpoint market entry opportunities. If you’re looking to streamline your trading approach, this could be the tool for you. Understanding the Sidus Method: One of the standout features of the Sidus Method is its simplicity; you won’t need to clutter your charts with extra filters. While losses can occur, they aren't frequent. This approach makes Forex trading more accessible and profitable, allowing traders to easily identify entry points for their positions. Main Parameters of the Sidus Method: Currency Pairs: Best suited for EUR/GBP and EUR/USD, though other pairs can be tested. Time Frames: Ideal on the H1 chart, but M30 can be used with caution due to a higher risk of false signals. Exponential Moving Averages (EMA): Utilize the 18 EMA and 28 EMA. Weighted Moving Averages (WMA): Use the 5 WMA and 8 WMA. The 18 EMA and 28 EMA create a tunnel effect on the chart, helping you recognize the beginnings and ends of significant trends. Meanwhile, the 5 WMA and 8 WMA will guide your entry points and assess the strength of short-term trends. Market Entry Signals with the Sidus Method: Buy Position: Open when the 5 WMA and 8 WMA cross upwards through the tunnel. A stronger signal occurs if the 5 WMA also crosses above the 8 WMA. Sell Position: Open when the 5 WMA and 8 WMA cross downwards through the tunnel. Again, a strong signal is present if the 5 WMA crosses below the 8 WMA. Exit Signals According to the Sidus Method: Buy Signal: Close your position when the price peaks and the 5 WMA dips below the 8 WMA. Sell Signal: Close your position when the price bottoms out and the 5 WMA climbs above the 8 WMA. Additionally, always consider closing your position if the tunnel borders start to overlap or converge into one line. This is a strong indication that a trend reversal might be on the horizon. Keep your eyes peeled if the 5 WMA and 8 WMA are approaching the tunnel; while it’s fine if they haven’t crossed yet, it’s usually the first sign that a change may come soon. Be prepared to act! The Sidus Indicator first hit the scene in MQL4 and was published on CodeBase at mql4.com back on October 25, 2007.

2012.02.07
Unlocking Trading Success with the WKBIBS Indicator for MetaTrader 5
MetaTrader5
Unlocking Trading Success with the WKBIBS Indicator for MetaTrader 5

Author: Rosh The WKBIBS indicator is a next-gen oscillator that combines the power of the WKB and IBS indicators. Whether you're just starting out in Forex or are a seasoned pro, this tool is a fantastic addition to your trading arsenal. What sets WKBIBS apart is its ability to provide earlier signals compared to standard Stochastic oscillators. Unlike other arrow indicators, it doesn’t give false signals or redraw, making it a reliable choice for traders looking for clarity and accuracy. How to Use WKBIBS: Trading with WKBIBS is straightforward: When the blue oscillator crosses the upper green line downwards, it’s a signal to sell. If the blue oscillator crosses the lower red line upwards, it’s time to buy. This simplicity is key—when you get a signal, the price on the chart is still valid for entering the market in the right direction. You can also tweak settings for trend filters and trade direction to suit your strategy. Input Parameters: //+-----------------------------------+ //| Indicator input parameters       | //+-----------------------------------+ input Smooth_Method IMA_Method=MODE_SMA;   // IBS smoothing method input int ILength=5;                       // IBS smoothing depth                     input int IPhase=15;                       // IBS smoothing parameter input Applied_price_ IPC=PRICE_HIGH_CLOSE; // IBS applied price input int IShift=0;                        // Horizontal shift of IBS in bars input bool IDirect=true;                   // Indicator vertical reverse extern uint RPeriod=25;                    // Extremums searching period input Smooth_Method SmMA_Method=MODE_SMA;  // Smoothing method input int SLength=3;                       // Smoothing depth input int SPhase=100;                      // Smoothing parameter input int SShift=0                        // Horizontal shift of the channel indicator in bars This indicator allows you to change the smoothing method: SMA - simple moving average; EMA - exponential moving average; SMMA - smoothed moving average; LWMA - linear weighted moving average; JJMA - JMA adaptive average; JurX - ultralinear smoothing; ParMA - parabolic smoothing; T3 - Tillson's multiple exponential smoothing; VIDYA - smoothing with the use of Tushar Chande's algorithm; AMA - smoothing with the use of Perry Kaufman's algorithm. A quick note on parameters: the phase type settings vary across smoothing algorithms. For example, in JMA, phase is an external variable ranging from -100 to +100. For T3, it’s a smoothing ratio multiplied by 100 for better visibility. With VIDYA, it relates to the CMO oscillator period, and for AMA, it's a slow EMA period. Meanwhile, for other algorithms, these parameters won’t affect smoothing. For AMA, the fast EMA period is fixed at 2 by default. This indicator utilizes the SmoothAlgorithms.mqh library classes (which you’ll need to copy to your terminal_data_folder\MQL5\Include). You can read more about these classes in the article "Averaging Price Series for Intermediate Calculations Without Using Additional Buffers". This indicator was initially created in MQL4 and first published on CodeBase on November 10, 2008.

2012.02.07
Mastering the Ultimate Oscillator: A Trader's Guide for MetaTrader 5
MetaTrader5
Mastering the Ultimate Oscillator: A Trader's Guide for MetaTrader 5

Author: Rosh If you're looking to sharpen your trading skills, the Ultimate Oscillator is a tool you won't want to overlook. Created by Larry Williams, this indicator combines three Stochastic indicators, each calculated over different periods to provide a weighted value. The typical ratio for these periods is 1:2:4 or 1:2:3, depending on market conditions. Popular settings include 7-14-28 or 7-14-21. Larry Williams himself recommends that traders consider entering positions when a divergence forms. Here’s how to navigate buy and sell signals effectively. Buy Signals: Look for bullish divergence: the price hits a new low, but the oscillator doesn’t follow suit. During the formation of bullish divergence, the oscillator should be below 30. When the oscillator surpasses the maximum level achieved during the bullish divergence, that's your golden opportunity to buy. Closing Long Positions: If the oscillator climbs to 50 and then dips below 45, it might be time to close your position. Keep an eye on the oscillator level: if it exceeds 70, it’s often wise to wait for a drop back to 70 before making any moves. Be alert for any sell signals that may arise. Sell Signals: Watch for bearish divergence: the price hits a new high while the indicator fails to do the same. During the formation of bearish divergence, the oscillator should be above 50. If the oscillator drops below the minimum level achieved during bearish divergence, consider that a sell signal. Closing Short Positions: If the oscillator rises above 65, it might be time to close your short positions. Conversely, if the oscillator drops below 30, that could indicate a buy signal. The Ultimate Oscillator first made its debut in MQL4 and was published in the Code Base on February 9, 2007. This indicator utilizes classes from the SmoothAlgorithms.mqh library, which you can read more about in the article titled "Averaging Price Series for Intermediate Calculations Without Using Additional Buffers." Ultimate Oscillator indicator

2012.02.06
Mastering the X2MA_KLx3_Cloud Indicator for MetaTrader 5
MetaTrader5
Mastering the X2MA_KLx3_Cloud Indicator for MetaTrader 5

The X2MA_KLx3_Cloud indicator, designed in the DRAW_FILLING style, showcases a vibrant colored background filling that traders will find visually compelling. Indicator Input Parameters: //+-----------------------------------+ //| Indicator Input Parameters       | //+-----------------------------------+ input Smooth_Method MA_Method1=MODE_SMA;  // First smoothing method input int Length1=40;                     // First smoothing depth input int Phase1=15;                      // First smoothing parameter input Smooth_Method MA_Method2=MODE_JJMA; // Second smoothing method input int Length2=20;                     // Second smoothing depth input int Phase2=100;                     // Second smoothing parameter input int KeltnerPeriod=20;               // Keltner smoothing period input double Ratio = 2.0;                 // First level ratio input Applied_price_ IPC=PRICE_CLOSE;     // Applied price input int Shift=0                        // Horizontal shift of the indicator in bars input int PriceShift=0                   // Vertical shift of the indicator in points The middle line of the indicator is crafted using an algorithm that employs two smoothing techniques, giving you the flexibility to choose from a variety of options: SMA - Simple Moving Average; EMA - Exponential Moving Average; SMMA - Smoothed Moving Average; LWMA - Linear Weighted Moving Average; JJMA - JMA Adaptive Average; JurX - Ultralinear Smoothing; ParMA - Parabolic Smoothing; T3 - Tillson's Multiple Exponential Smoothing; VIDYA - Smoothing using Tushar Chande's algorithm; AMA - Smoothing using Perry Kaufman's algorithm. Keep in mind that the Phase1 and Phase2 parameters vary in significance depending on the chosen smoothing algorithm. For instance, in the case of JMA, it acts as an external Phase variable ranging from -100 to +100. For T3, it serves as a smoothing ratio multiplied by 100 for clarity, while in VIDYA, it represents the CMO oscillator period, and for AMA, it signifies a slow EMA period. In other algorithms, these parameters may not influence smoothing. Notably, for AMA, the fast EMA period is fixed and set to 2 by default, and the ratio also stands at 2. This indicator utilizes the SmoothAlgorithms.mqh library classes, which you must copy to the terminal_data_folder\MQL5\Include. For a detailed explanation on using these classes, check out the article "Averaging Price Series for Intermediate Calculations Without Using Additional Buffers".

2012.02.04
Understanding the IBS Indicator for MetaTrader 5: A Trader's Guide
MetaTrader5
Understanding the IBS Indicator for MetaTrader 5: A Trader's Guide

Author: Rosh The Internal Bar Strength (IBS) indicator, crafted by Volker Knapp, is a powerful tool for traders using MetaTrader 5. How the IBS Indicator Works The IBS is calculated using a simple formula that reflects the strength of price movements within a specific bar. Here’s a quick look at the equation: IBS = ((Close - Low) / (High - Low)) * 100% How to Use the IBS Indicator Typically, a five-bar period is employed for analysis. When the IBS crosses above the 60% mark, it suggests overbought conditions, signaling a potential selling opportunity. Conversely, a drop below the 40% threshold indicates oversold conditions, which can present a buying opportunity. Input Parameters for Customization //+-----------------------------------+ //| Indicator input parameters | //+-----------------------------------+ input Smooth_Method IMA_Method=MODE_SMA; // Smoothing method input int ILength=12; // Smoothing depth input int IPhase=15; // Smoothing parameter input Applied_price_ IPC=PRICE_CLOSE_LOW;// Applied price input int Shift=0; // Horizontal shift of the indicator in bars Smoothing Methods Available This indicator provides the flexibility to switch between various smoothing methods: SMA - Simple Moving Average; EMA - Exponential Moving Average; SMMA - Smoothed Moving Average; LWMA - Linear Weighted Moving Average; JJMA - JMA Adaptive Average; JurX - Ultralinear Smoothing; ParMA - Parabolic Smoothing; T3 - Tillson's Multiple Exponential Smoothing; VIDYA - Smoothing using Tushar Chande's Algorithm; AMA - Smoothing using Perry Kaufman's Algorithm. Keep in mind that the Phase type parameters differ across smoothing algorithms. For instance, with JMA, the Phase variable ranges from -100 to +100, while for T3, it's a smoothing ratio multiplied by 100 for clarity. For other algorithms like VIDYA and AMA, these parameters play different roles, so make sure to adjust them accordingly. The IBS indicator leverages classes from the SmoothAlgorithms.mqh library (ensure it's copied to your terminal_data_folder\MQL5\Include). You can find a detailed explanation of these classes in the article "Averaging Price Series for Intermediate Calculations Without Using Additional Buffers". This indicator was initially developed in MQL4 and made its debut on CodeBase back on October 10, 2008.

2012.02.04
First Previous 243 244 245 246 247 248 249 250 251 252 253 Next Last