Technical Indicator

Mastering the Inter Indicator for MetaTrader 5: A Trader's Guide
MetaTrader5
Mastering the Inter Indicator for MetaTrader 5: A Trader's Guide

The Inter Indicator was designed to make it easier for traders to get synchronized and normalized data, which is essential for feeding into neural networks. This tool syncs data based on the symbol where it’s installed, making it a handy addition to your trading toolkit. Who knows? You might even discover additional ways to leverage this indicator in your trading strategies! 
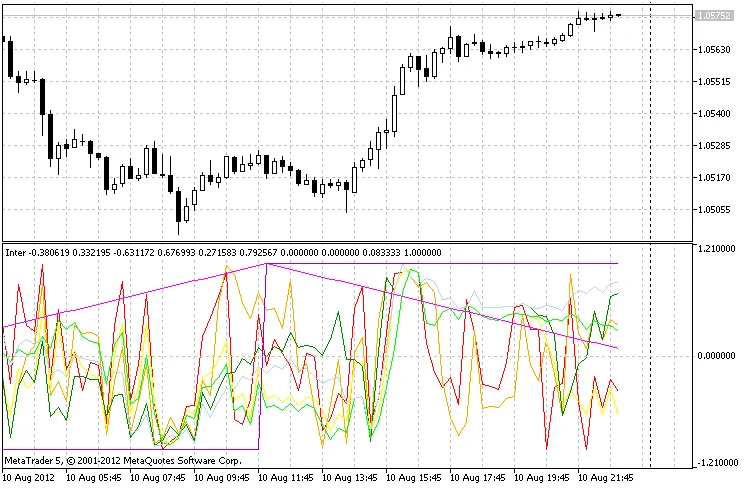
The Inter Indicator can display up to 10 lines (buffers) from various symbols, timeframes, and signals, giving you a comprehensive view of the market. Input Parameters: Instrument: The name of the instrument (symbol) chosen from the list. Variant: The variant for indicator calculation, selected from a list. Timeframe: The specific timeframe for the indicator calculation. Parameter: The key parameter for calculation (period). Available Calculation Variants: NONE: No calculation performed. HLP: Calculated as the ratio of maximums and minimums over the previous “Parameter” bars. Op0_OpN: Calculated as Open[0] - Open[Parameter]. RSI: Standard RSI calculated using the “Parameter” period. Stoch: Regular Stochastic using parameters “Parameter, 3, 3”. Op0_Ma: Open[0] - iMa[0] with the “Parameter” smoothing period. Ma0_Ma1: Ma[0] - Ma[1] with the “Parameter” smoothing period. Time: The “Parameter” represents the time of day (can be 0 or >=1). Each of the ten buffers utilizes similar parameters, giving you flexibility in your analysis. When calculating Op0_OpN, Op0_Ma, and Ma0_Ma1, the indicator normalizes values to a range of -1 to +1 as new data comes in. To ensure accurate calculations, it’s advisable to set the Maximum Bars Calculate parameter to at least double the amount of data you need.

2012.09.18
Unlocking the Power of MARSICD: A Comprehensive Guide for MetaTrader 5
MetaTrader5
Unlocking the Power of MARSICD: A Comprehensive Guide for MetaTrader 5

Author: John Q. Aimsson The MARSICD indicator is a powerful trend tool designed for MetaTrader 5, utilizing two RSI oscillators to give you a clearer picture of market movements. Think of it as a combination of the ADX and MACD indicators, all wrapped up in one neat package on your chart. Originally developed in MQL4, this indicator made its debut back on June 7, 2012, and has been helping traders refine their strategies ever since. You can check out the original code here. To get the most out of MARSICD, you’ll need to incorporate the SmoothAlgorithms.mqh library classes into your setup. Make sure to place them in your terminal data folder under MQL5\Include. If you’re curious about how these classes work, you can dive into the article Averaging Price Series for Intermediate Calculations Without Using Additional Buffers. Input Parameters: //+----------------------------------------------+ //|  Indicator input parameters                 | //+----------------------------------------------+ input Smooth_Method MAMethod=MODE_LWMA; //Smoothing method input uint ARSI_PERIOD=14;              //RSI A period input uint RRSI_PERIOD=14;              //RSI R period input uint AMA_PERIOD=5;                //Signal A period input uint RMA_PERIOD=5;                //Signal R period input uint sMAD_PERIOD=21;              //Signal period for the histogram input uint MPhase=15; //Smoothing parameter MARSICD Indicator in Action

2012.09.17
Mastering the Height of the Period Indicator in MetaTrader 5
MetaTrader5
Mastering the Height of the Period Indicator in MetaTrader 5

Understanding the Height of the Period Indicator If you’re trading with MetaTrader 5, you might have come across the Height of the Period indicator. This useful tool provides insights into price movements, helping you make informed trading decisions. Let’s break down how it works and how you can leverage it to enhance your trading strategy. What is the Height of the Period Indicator? The Height of the Period indicator measures the price range over a specific period. It's essentially the difference between the highest and lowest prices during that timeframe. By keeping an eye on this indicator, you can identify volatility in the market, which is crucial for timing your trades effectively. How to Use the Height of the Period Indicator Identify Trends: A wider height may indicate increased volatility, which can signal a strong trend. Conversely, a narrow height might suggest a period of consolidation. Set Entry and Exit Points: Knowing the price range can help you set more accurate stop-loss and take-profit levels. Combine with Other Indicators: Pairing the Height of the Period with other tools, like moving averages or RSI, can give you a more rounded view of market conditions. Final Thoughts Incorporating the Height of the Period indicator into your trading toolkit can provide valuable insights into market dynamics. Remember, it’s all about understanding the context of the market. Keep experimenting, and you’ll soon find the sweet spot for your trading style!

2012.09.17
Unlocking the GMACD Indicator for MetaTrader 5: A Trader's Guide
MetaTrader5
Unlocking the GMACD Indicator for MetaTrader 5: A Trader's Guide

Author: GurievEugen The GMACD, or Generalized Moving Average Convergence Divergence, is a handy tool that many traders love to use. While this two-line MACD indicator is a staple on many trading platforms, you won’t find it natively in MetaTrader 5. But fear not, because I’ve got your back! This indicator was first introduced in MQL4 and published on Code Base back on July 2, 2012. If you’re eager to incorporate it into your trading strategy, you’ll need to use classes from the SmoothAlgorithms.mqh library. Be sure to copy this into your terminal_data_directory/MQL5/Include folder to get everything running smoothly. For those who want to dive deeper, there’s a detailed guide available in the article titled Averaging Price Series for Intermediate Calculations Without Using Additional Buffers. It’s a great resource to understand how to effectively use these classes. Input Parameters: //+-----------------------------------+ //| Indicator input parameters      | //+-----------------------------------+ input Smooth_Method XMA_Method=MODE_T3; // Histogram smoothing method input int Fast_XMA = 12; // Fast moving average period input int Slow_XMA = 26; // Slow moving average period input int XPhase= 100;   // Moving averages smoothing parameter input Smooth_Method Signal_Method=MODE_JJMA; // Signal line smoothing method input int Signal_XMA=9; // Signal line period input int Signal_Phase=100; // Signal line parameter input int AppliedPrice=PRICE_CLOSE_; // Price constant Illustration: Fig.1 GMACD Indicator

2012.08.13
First Previous 240 241 242 243 244 245 246 247 248 249 250 Next Last