Technical Indicator

Mastering the True MFI: A Game-Changer for Your Trading Strategy
MetaTrader5
Mastering the True MFI: A Game-Changer for Your Trading Strategy

Introduction to the True MFI Indicator Author: VladMsk In the world of trading, price movements often come hand in hand with increased trading activity. This is where the True MFI (Money Flow Index) indicator steps in, aiming to leverage this relationship. Unlike the traditional MFI that primarily relies on price for its calculations, the True MFI takes a different approach. It uses price to determine the direction of the movement while incorporating volume to gauge the strength of that movement. Why Choose True MFI Over Standard MFI? The standard MFI is somewhat akin to the Relative Strength Index (RSI), which can make it less appealing for traders seeking unique insights. The True MFI, however, stands out by combining both price and volume data, offering a more comprehensive view of market dynamics. As with most indicators, the effectiveness of the True MFI tends to improve as you increase your timeframe. Technical Insights The True MFI indicator utilizes classes from the SmoothAlgorithms.mqh library. If you're interested in diving deeper into how this class works, check out the article "Averaging Price Series for Intermediate Calculations Without Using Additional Buffers". History and Development This innovative indicator was first developed in MQL4 and made its debut on the Code Base back on June 15, 2010. Since then, it has gained traction among traders looking for an edge in their analysis. Visual Reference Fig.1 The True MFI indicator

2012.12.12
Mastering the Breakout Bars Trend Indicator for MetaTrader 5
MetaTrader5
Mastering the Breakout Bars Trend Indicator for MetaTrader 5

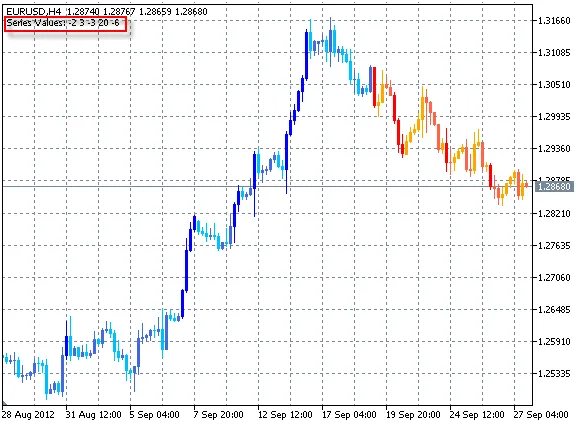
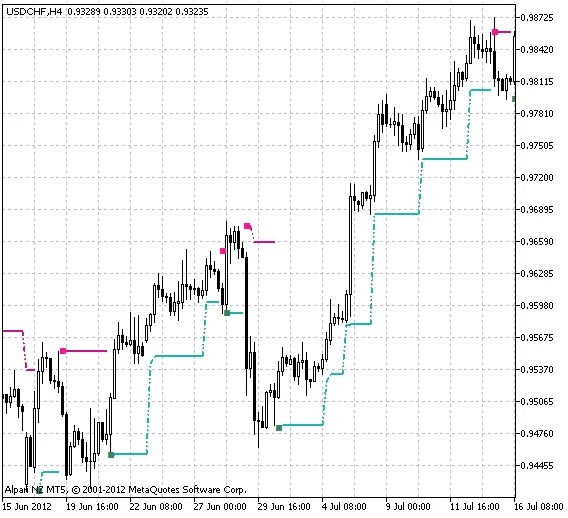
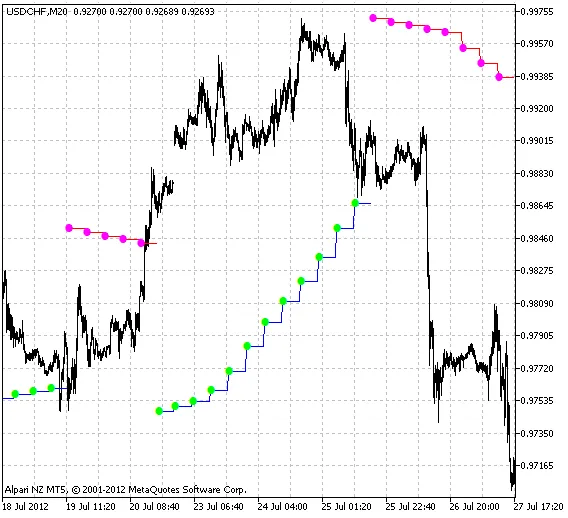
If you're looking to refine your trading strategy, the Breakout Bars Trend indicator for MetaTrader 5 might just be your new best friend. This tool serves as a clever alternative to traditional moving averages, helping you pinpoint trend directions more effectively. Think of it as a hybrid between a linear reversal and the iMovement indicator, but with a twist.The primary distinction lies in how the reversal parameter, or delta, is calculated. Instead of relying solely on the closing price, it utilizes the extremums—specifically the high and low points. The indicator identifies a reversal not just based on the delta, but also on what we call the breakthrough bar, which occurs when the price surpasses a specific level. A breakthrough bar is essentially one that closes above the previous bar's high or below its low. This isolation of such bars can be visualized as the formation of a new box on your chart, resembling three linear reversals.Recommendations:The main goal of the Breakout Bars Trend indicator is to help you establish the trend direction, though it's best paired with other settings to pinpoint your entry and exit points.It can also stand alone. For example, if the last 3-4 series show just 1-3 breakthrough bars, it indicates a flat market lacking a clear direction. This often precedes the emergence of a strong uptrend. In our example above, we see a sequence of -2, 3, -3 that leads to a robust trend with 20 breakthrough bars—resulting in about 6000 pips before the next turn. Here, the reversal parameter is set at 1500.

2012.12.10
Unlocking the ColorXOSMA_HTF Indicator for Enhanced Trading with MetaTrader 5
MetaTrader5
Unlocking the ColorXOSMA_HTF Indicator for Enhanced Trading with MetaTrader 5

If you’re looking to step up your trading game, the ColorXOSMA_HTF indicator for MetaTrader 5 might just be the tool you need. This nifty indicator allows you to set it to a fixed timeframe that differs from your chart's timeframe, giving you a fresh perspective on market trends. Choose Your Averaging Algorithm One of the standout features of ColorXOSMA is its flexibility in averaging algorithms. You can choose from ten different options: SMA - Simple Moving Average EMA - Exponential Moving Average SMMA - Smoothed Moving Average LWMA - Linear Weighted Moving Average JJMA - Adaptive Averaging JMA JurX - Ultralinear Averaging ParMA - Parabolic Averaging T3 - Tillson's Multiple Exponential Smoothing VIDYA - Smoothing with Tushar Chande's Algorithm AMA - Perry Kaufman's Algorithm Keep in mind that the parameters for Phase1 and Phase2 vary with each smoothing algorithm. For instance, in JMA, Phase is an external variable that ranges from -100 to +100. However, for T3, it’s a smoothing ratio multiplied by 100 for better visibility. For the VIDYA, it refers to the CMO oscillator period, while for AMA, it’s a slow EMA period. Some algorithms don't require these parameters to influence averaging, like the AMA, which has a fixed fast EMA period set to 2 by default. Market Conditions at a Glance What’s more, the color of the histogram changes based on current market conditions, providing you with an immediate visual cue. Getting Started To make the most out of the ColorXOSMA indicator, ensure you have the SmoothAlgorithms.mqh library classes copied to your terminal's data folder under MQL5\Include. You can find a detailed explanation of using these classes in the article "Averaging Price Series for Intermediate Calculations Without Using Additional Buffers". Don't forget to place the ColorXOSMA.mq5 indicator into your terminal's data folder under MQL5\Indicators. Fig.1 The ColorXOSMA_HTF Indicator

2012.12.07
First Previous 235 236 237 238 239 240 241 242 243 244 245 Next Last