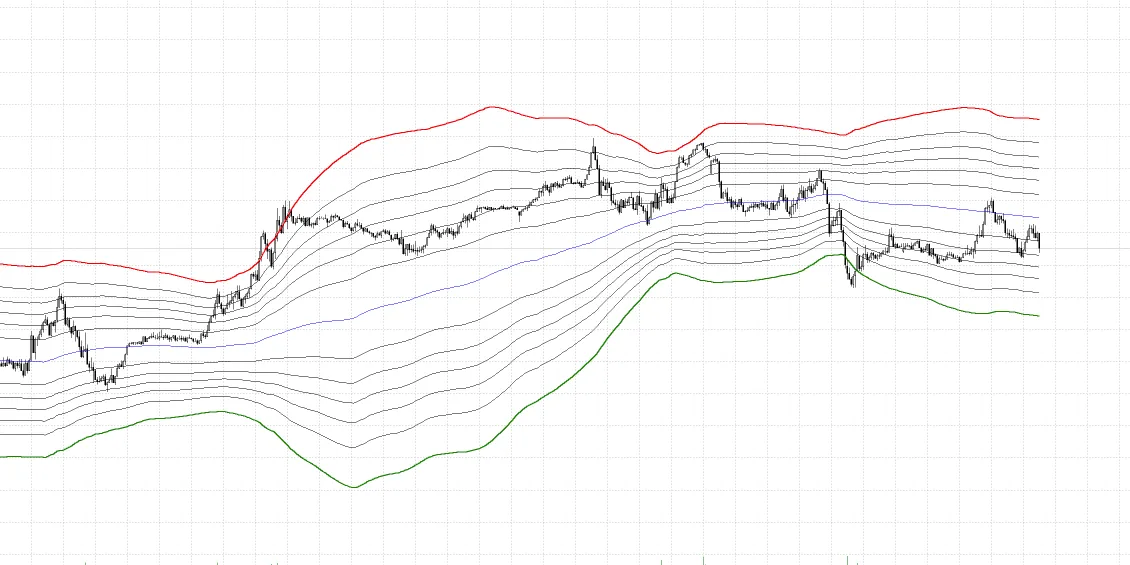
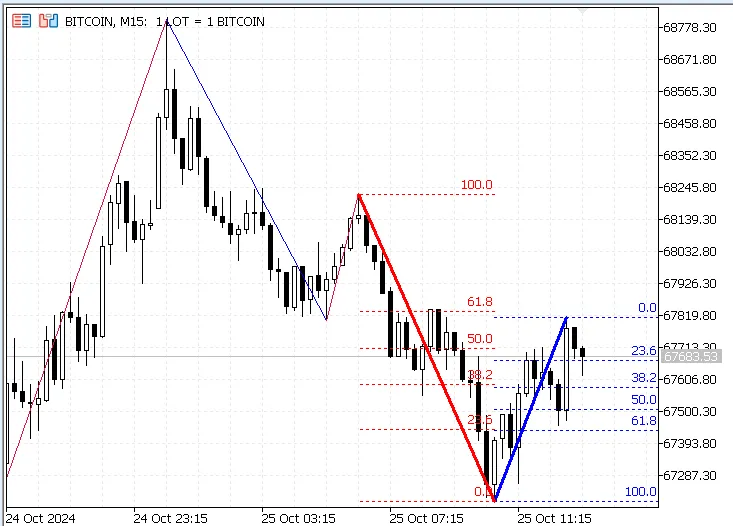
Hey traders! If you're looking to enhance your trading game, let me introduce you to the Double ZigZ...
What Are Fibonacci Bollinger Bands? The Fibonacci Bollinger Bands indicator is a fantastic tool that...
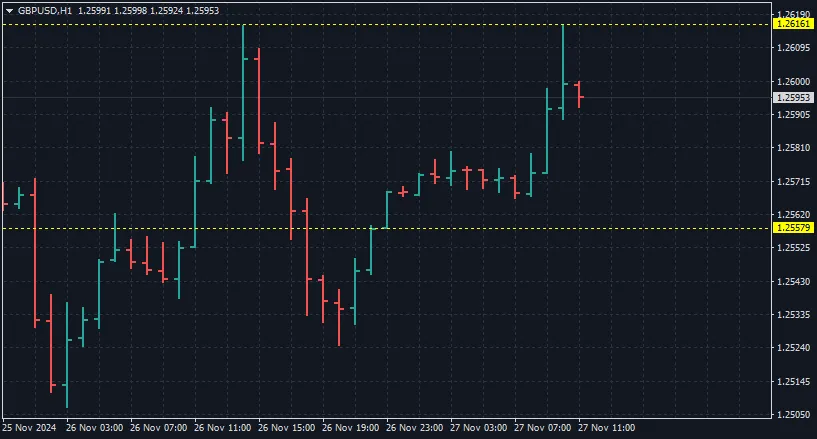
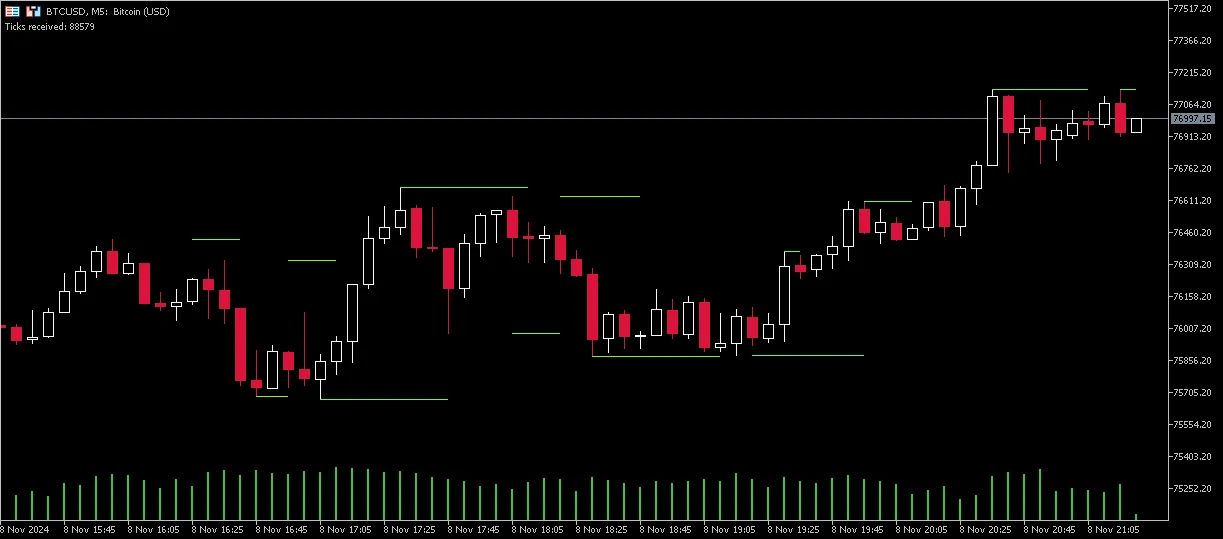
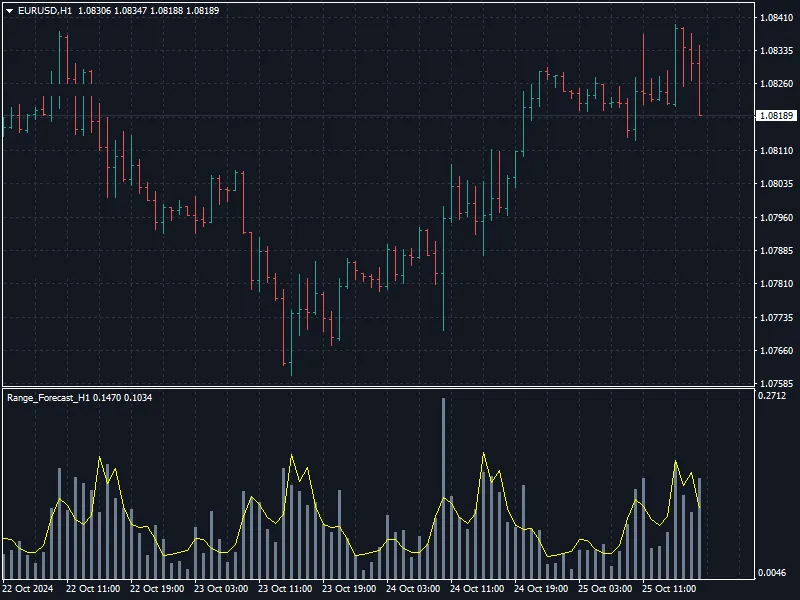
Hey fellow traders! If you're looking to sharpen your trading game, the Range Levels indicator for M...
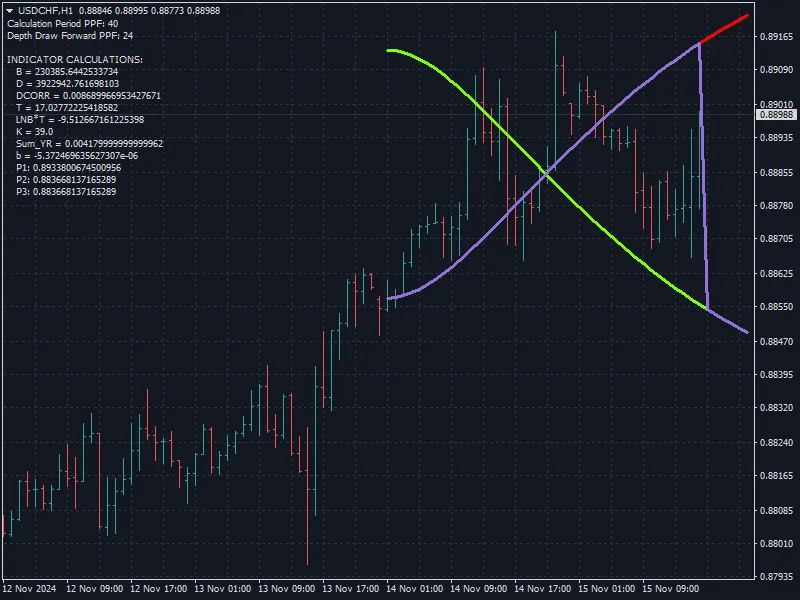
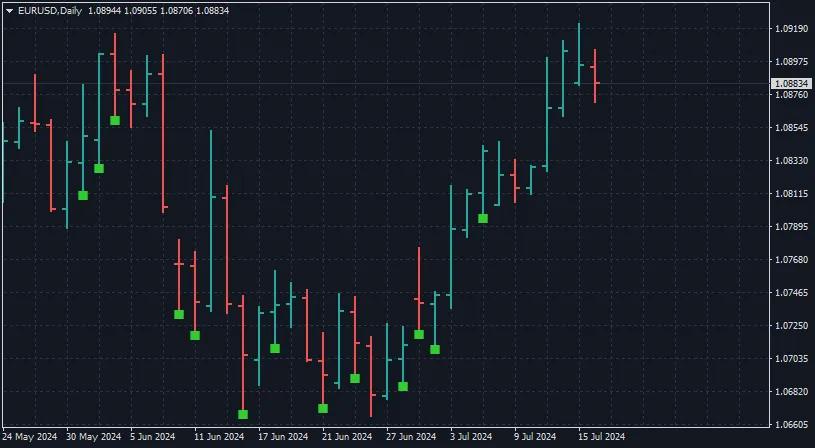
Hey fellow traders! Today, let’s dive into the PPF indicator, developed by Yousufkhodja Sultonov. Th...
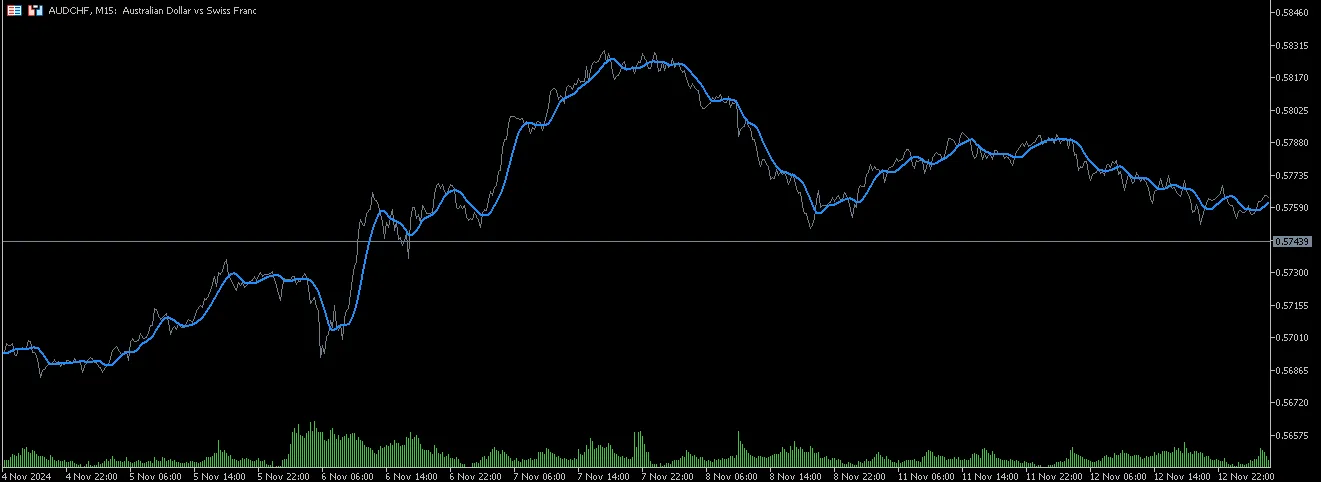
Hey there, fellow traders! Today, let’s dive into a nifty tool that can help you refine your trading...
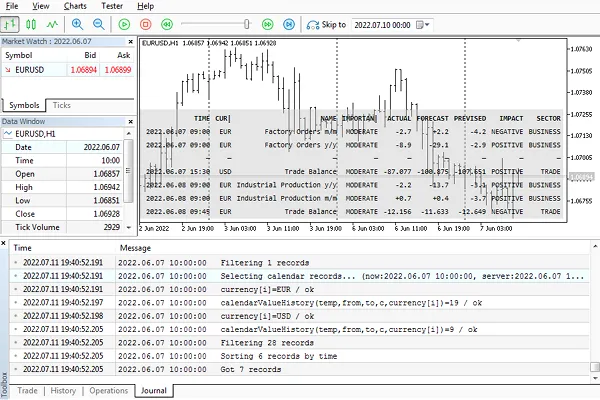
Let’s cut to the chase: MetaTrader 5's built-in economic calendar isn't perfectly synced with histor...
If you're looking to take your trading game to the next level, you should definitely check out this ...
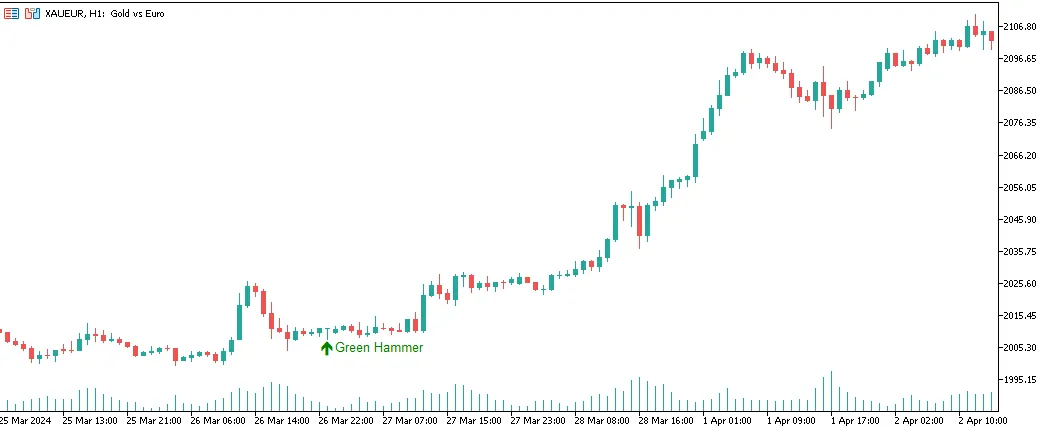
If you’re looking to level up your trading game, the Hammer Indicator might just be the tool you nee...
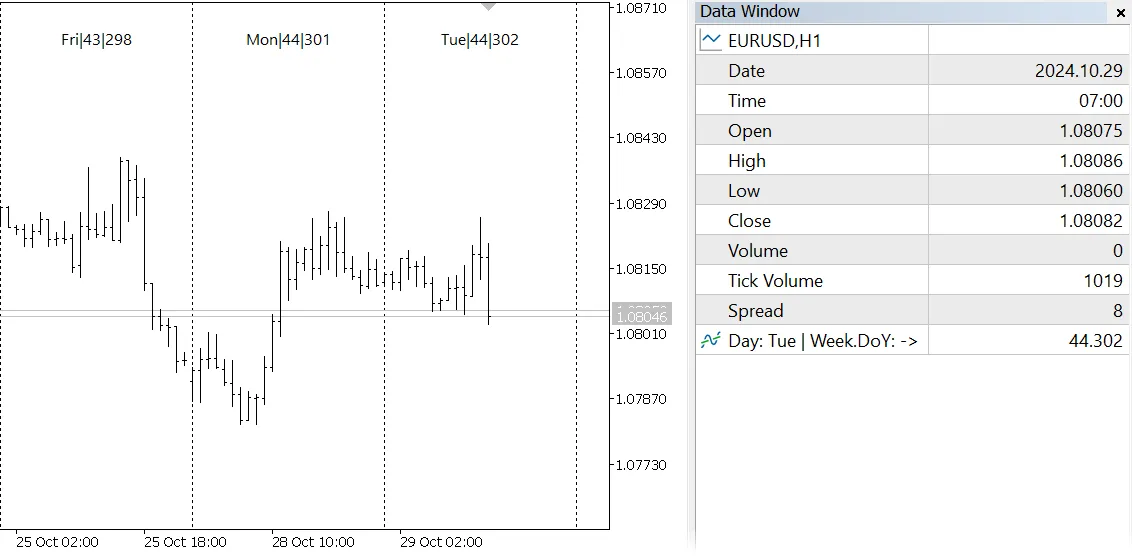
The WeekDays Indicator is a fantastic tool that displays the Day of the Week, Week of the Year, Day ...
If you're diving into the world of trading on MetaTrader 4, one tool you might want to get familiar ...
Features: Automatic Fibonacci Levels: This nifty indicator automatically charts Fibonacci retraceme...
Hey traders! Today, let’s dive into a handy indicator that can really sharpen your analysis on MetaT...
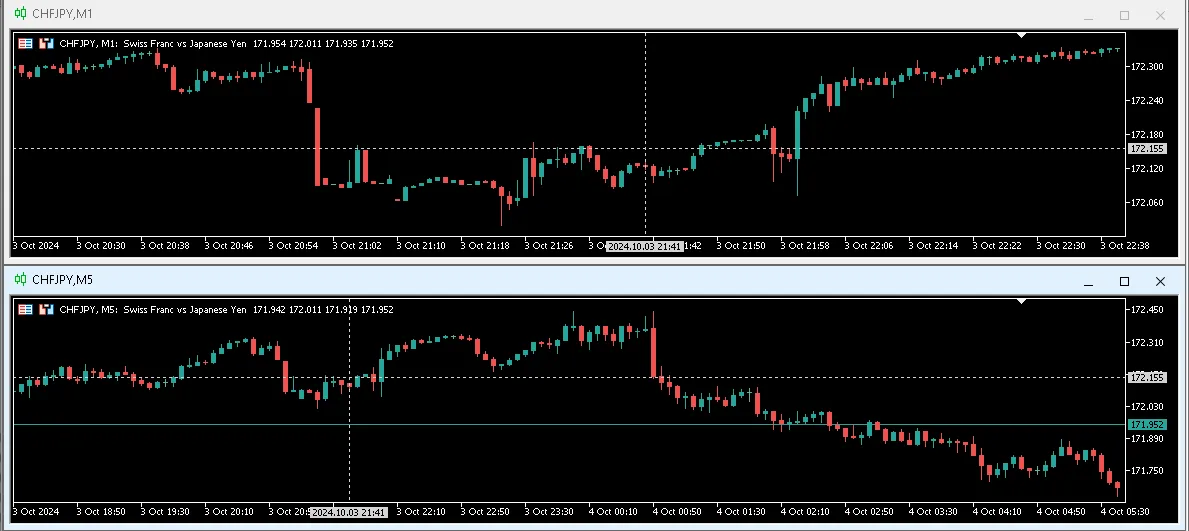
If you're a trader who loves to analyze multiple timeframes, then a custom crosshair cursor is a gam...
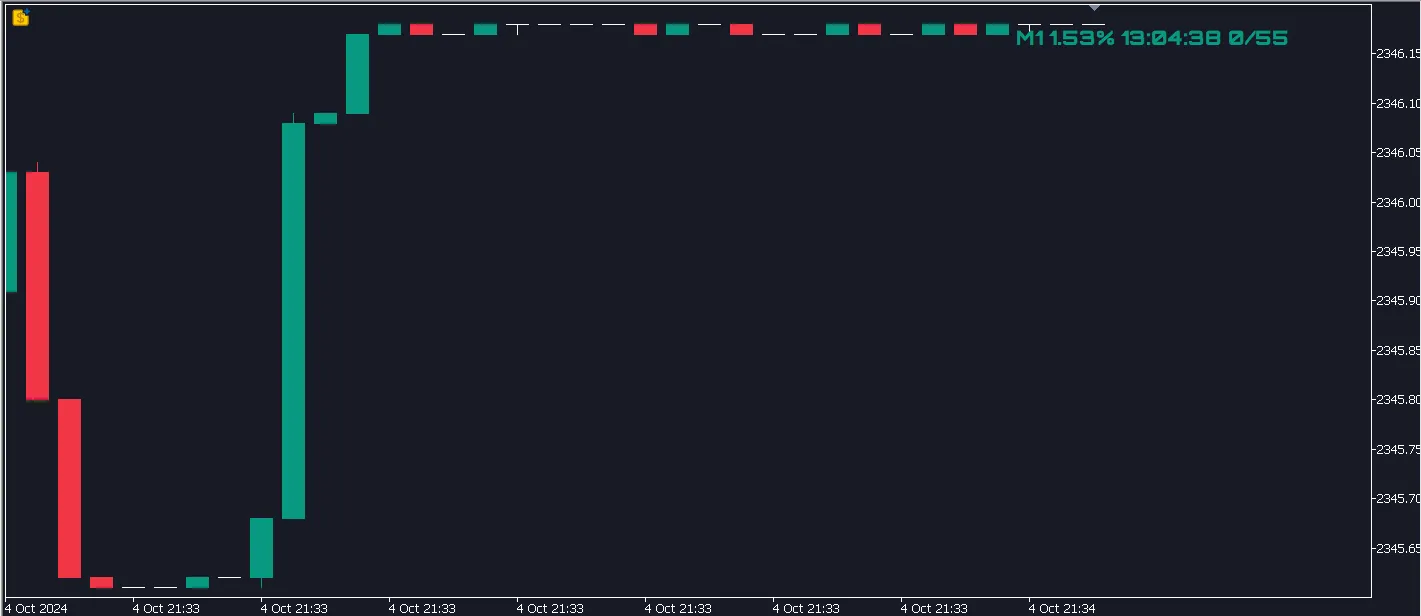
If you're looking to enhance your trading game, the Perfect Seconds Chart indicator for MetaTrader 5...
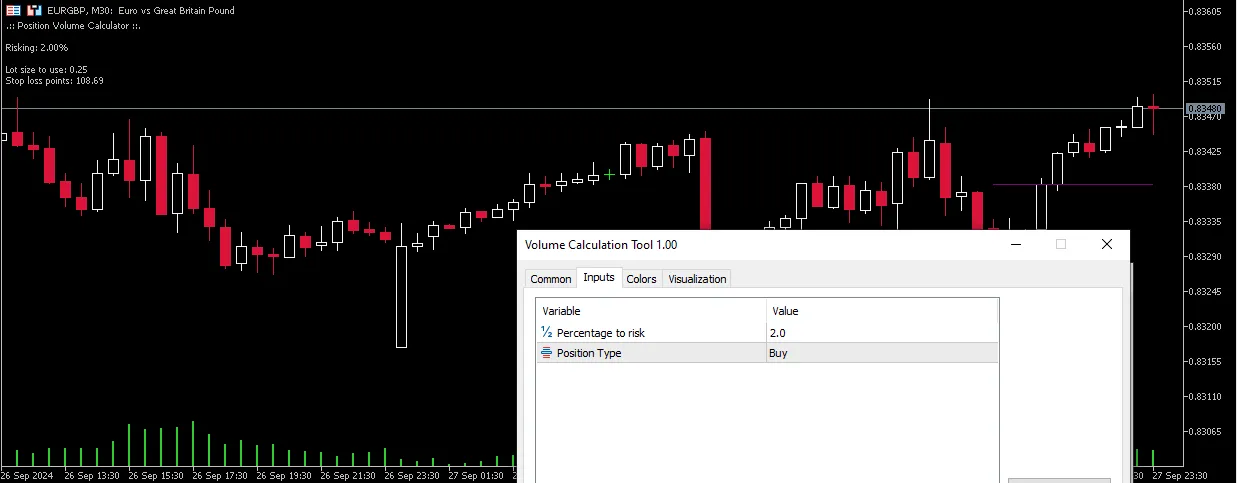
If you're looking to sharpen your trading strategy, you've come to the right place. This tool is des...
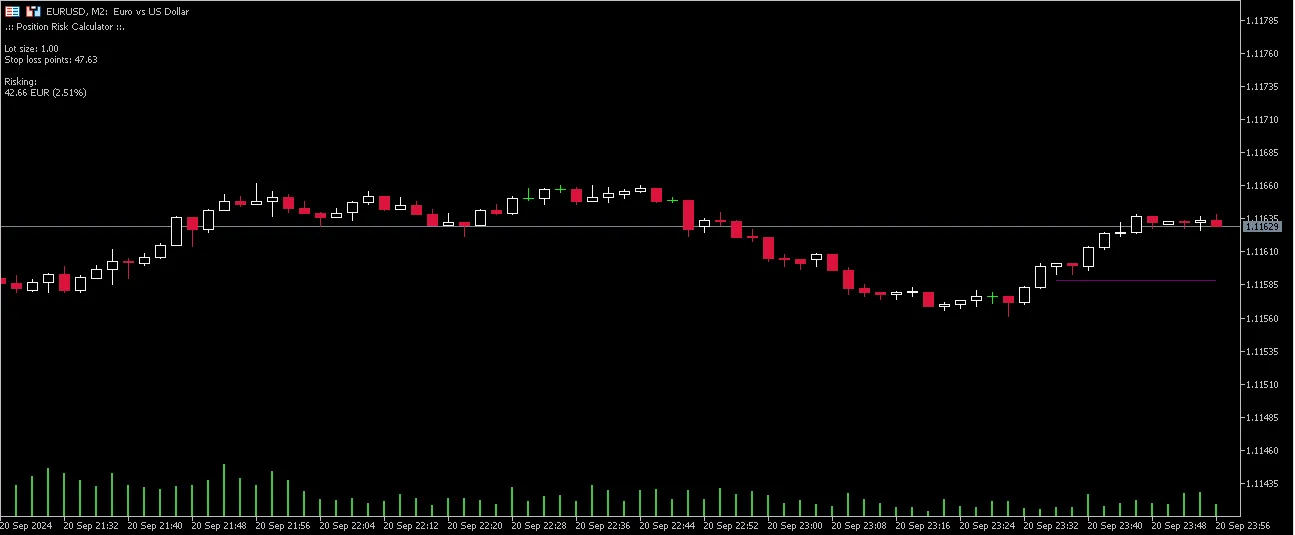
If you're serious about trading, understanding your position risk is crucial. That's where our handy...
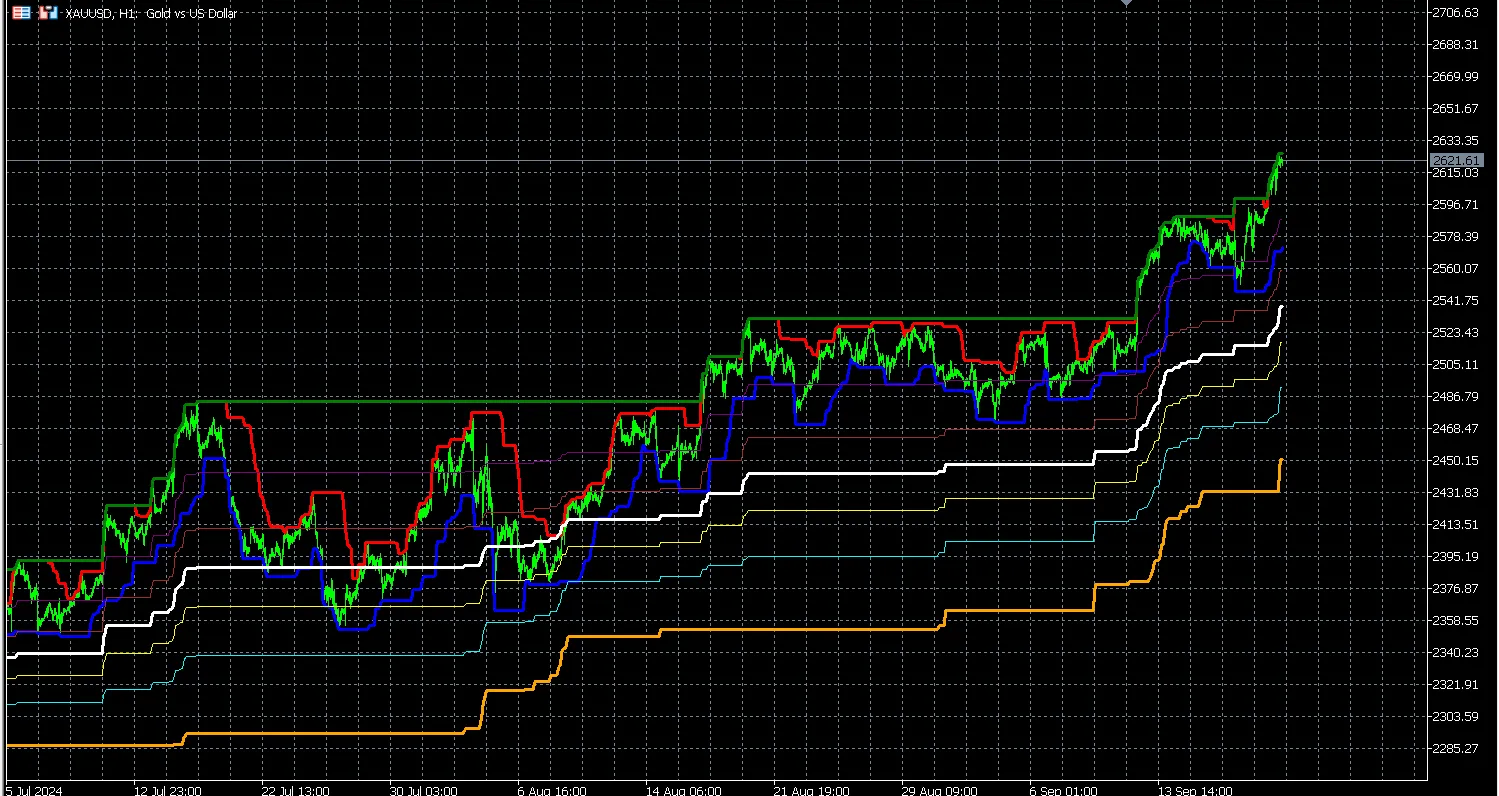
Introducing the PTB.mq5 Indicator Overview: The PTB.mq5 indicator is a powerful tool for ...
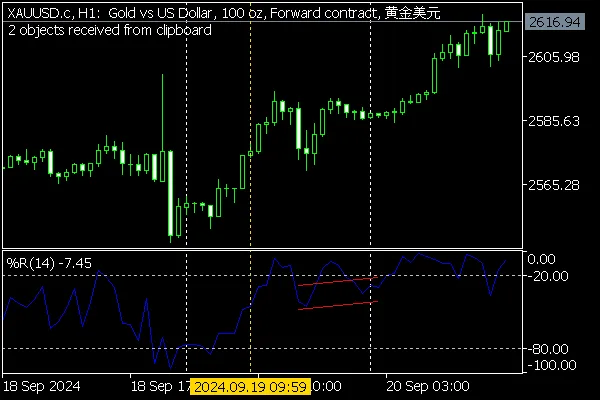
Hey there, fellow traders! Have you ever found yourself needing to copy and paste graphical objects ...
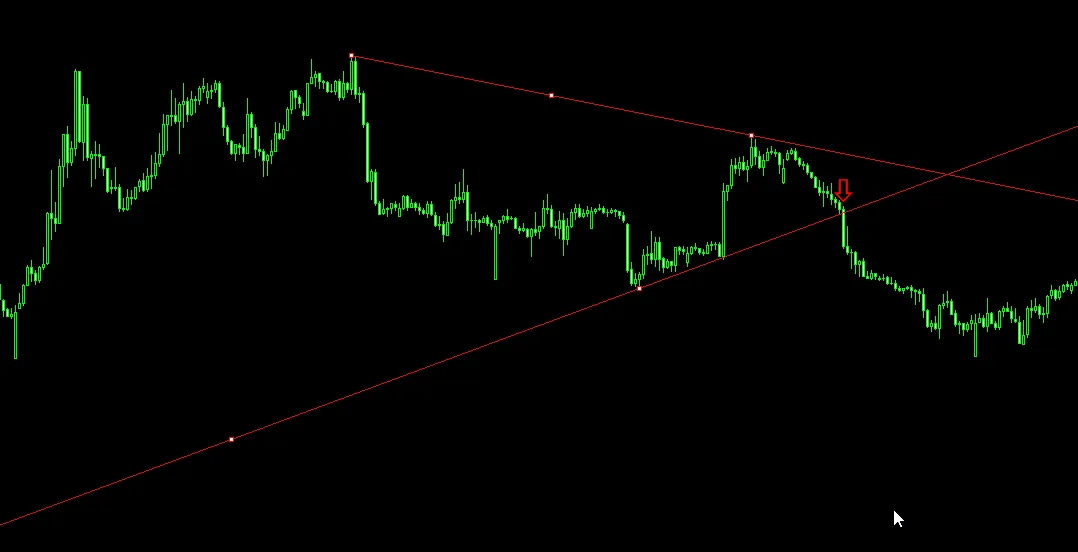
Hey traders! If you’re looking to up your game, let me introduce you to the Trendline Alert V1 for M...
Hey there, fellow traders! If you're looking to up your trading game with MetaTrader 5, let’s talk a...