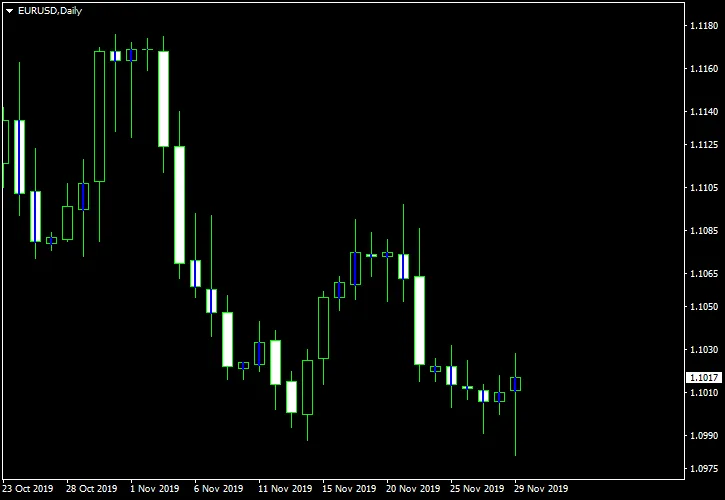
Basing Candlesticks Indicator for MetaTrader 5 is a handy tool that automatically spots and marks ba...
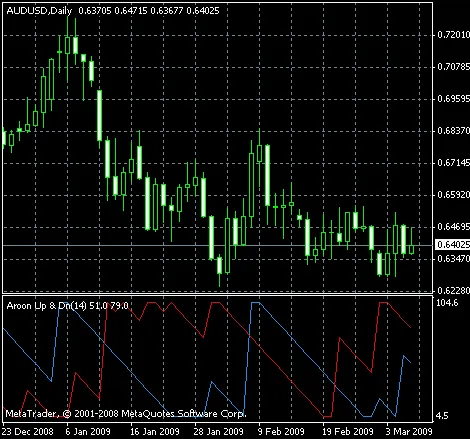
Hey there, fellow traders! Today, we're diving into the Aroon Up & Down indicator for MetaTrader 4. ...
If you’re looking to sharpen your trading skills, the Aroon Up and Down indicator for MetaTrader 5 i...
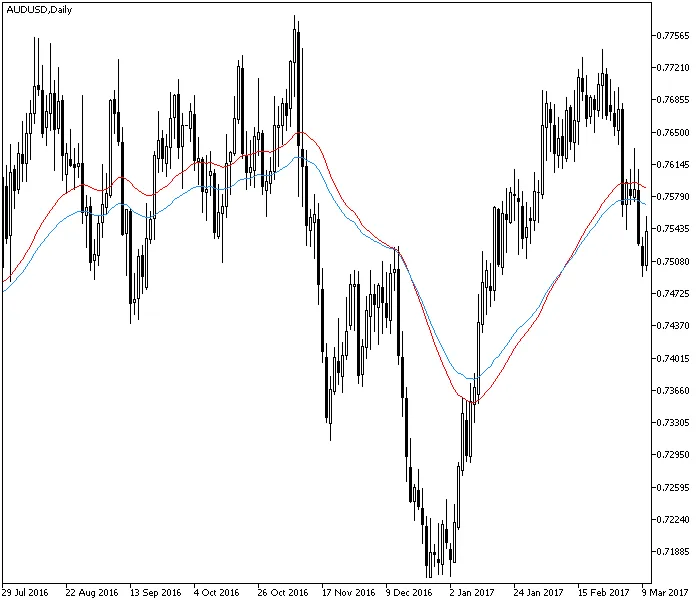
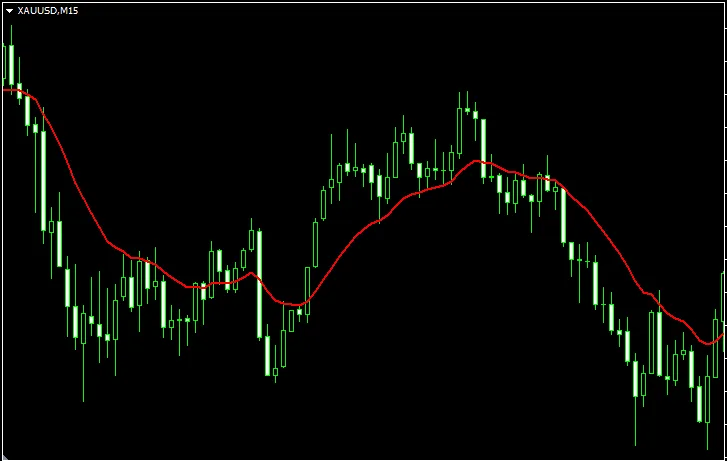
The 3rd Generation Moving Average is a sophisticated upgrade of the traditional moving average (MA) ...
Discover the 3rd Generation Moving Average for MT4 The 3rd Generation Moving Average is a cutting-ed...
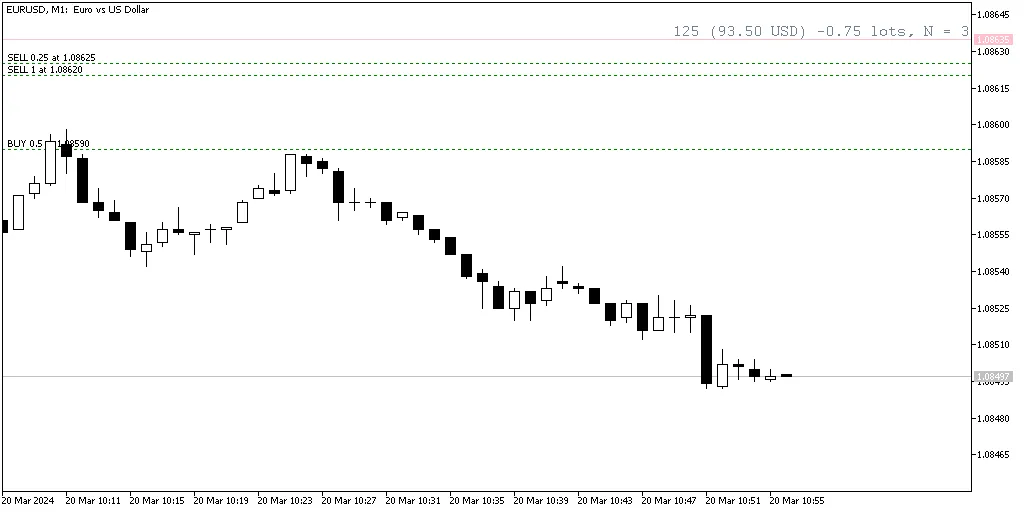
Breakeven Line Indicator is a must-have tool for any serious trader using MetaTrader. This indicator...
What is the Breakeven Line Indicator? The Breakeven Line Indicator is a handy tool for traders using...
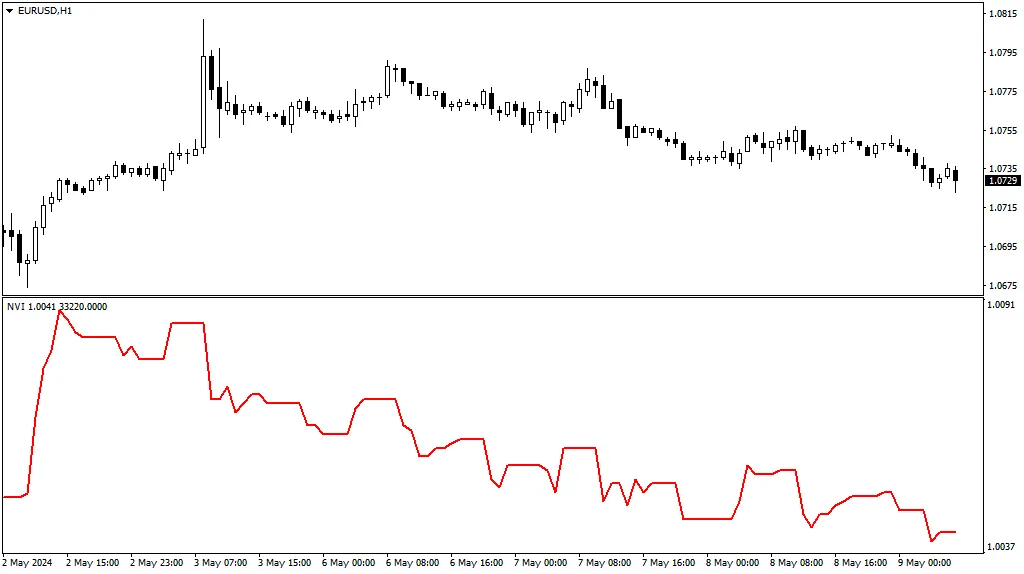
Negative Volume Index (NVI) is a versatile technical indicator available for advanced chart analysis...
Negative Volume Index (NVI) is a powerful technical indicator available for free on both MT4 and MT5...
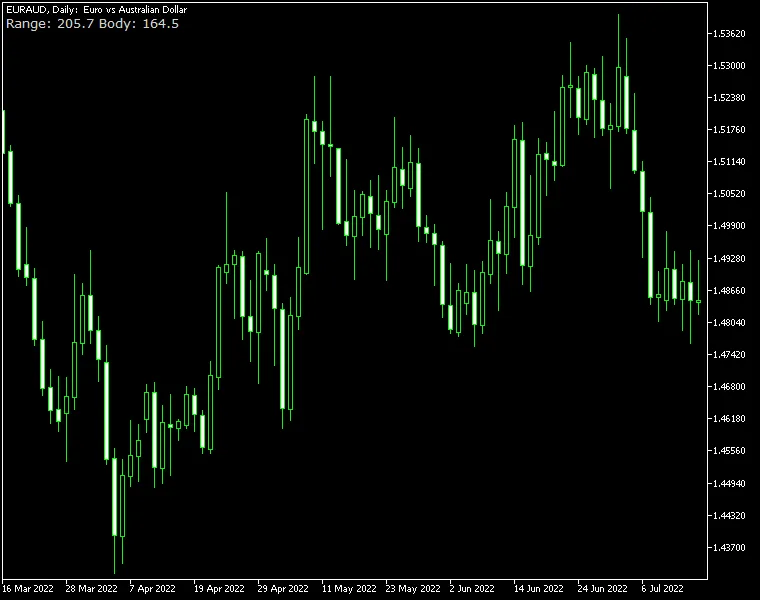
The Candle Range Indicator for MetaTrader is a straightforward and lightweight tool designed for tra...
Candle Range Indicator for MetaTrader is an incredibly user-friendly and lightweight tool designed t...
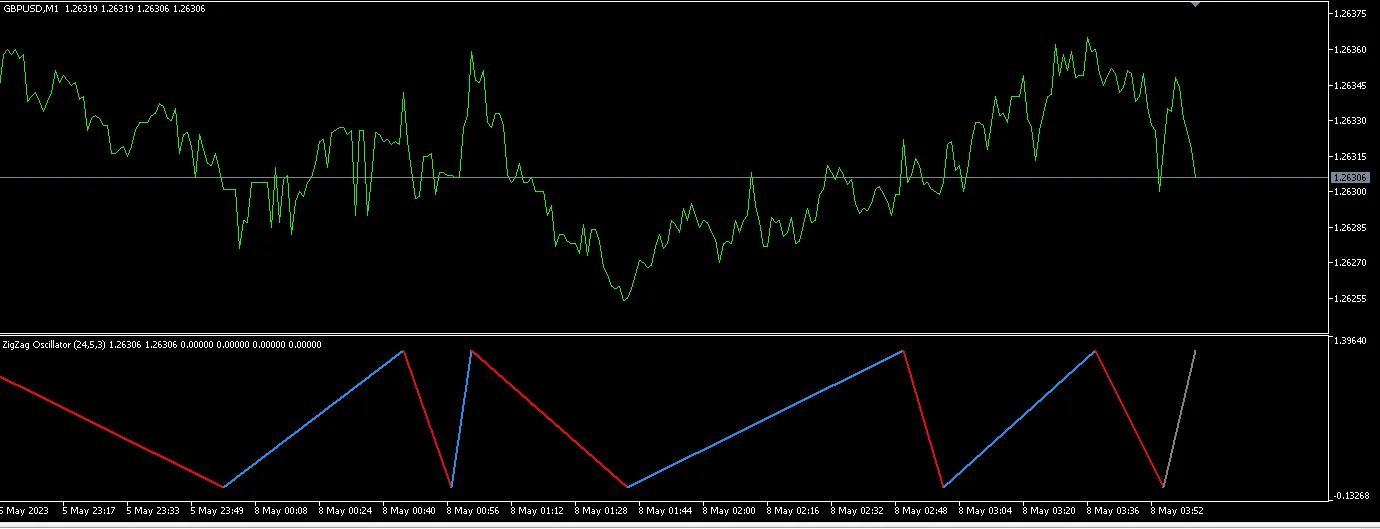
If you're looking to enhance your trading strategy, the Zigzag Fibo Oscillator might just be the qui...
Settings and Parameters General Parameters Momentum PeriodThis setting determines how many candl...
Hey fellow traders! If you're looking to enhance your trading game on MetaTrader 5, you’ve landed in...
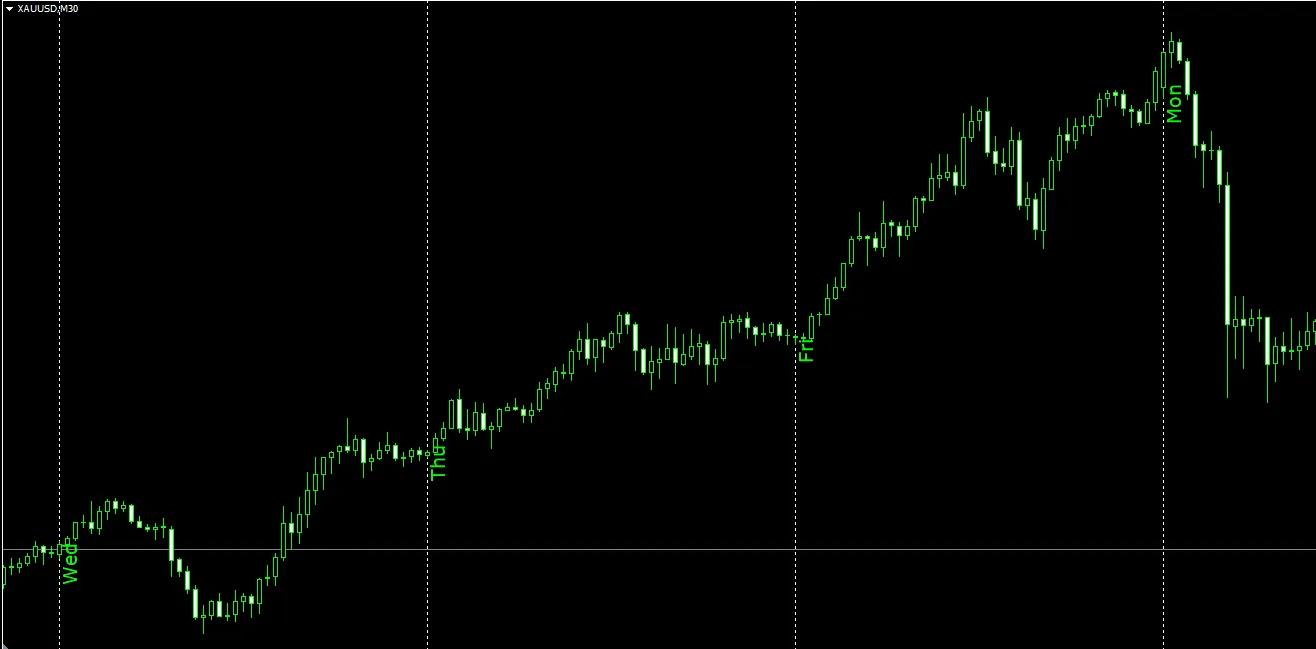
Hey there, fellow traders! Have you ever wished you could easily keep track of what day it is while ...
If you're looking to enhance your trading strategy, the Multi-Timeframe (MTF) Moving Average indicat...
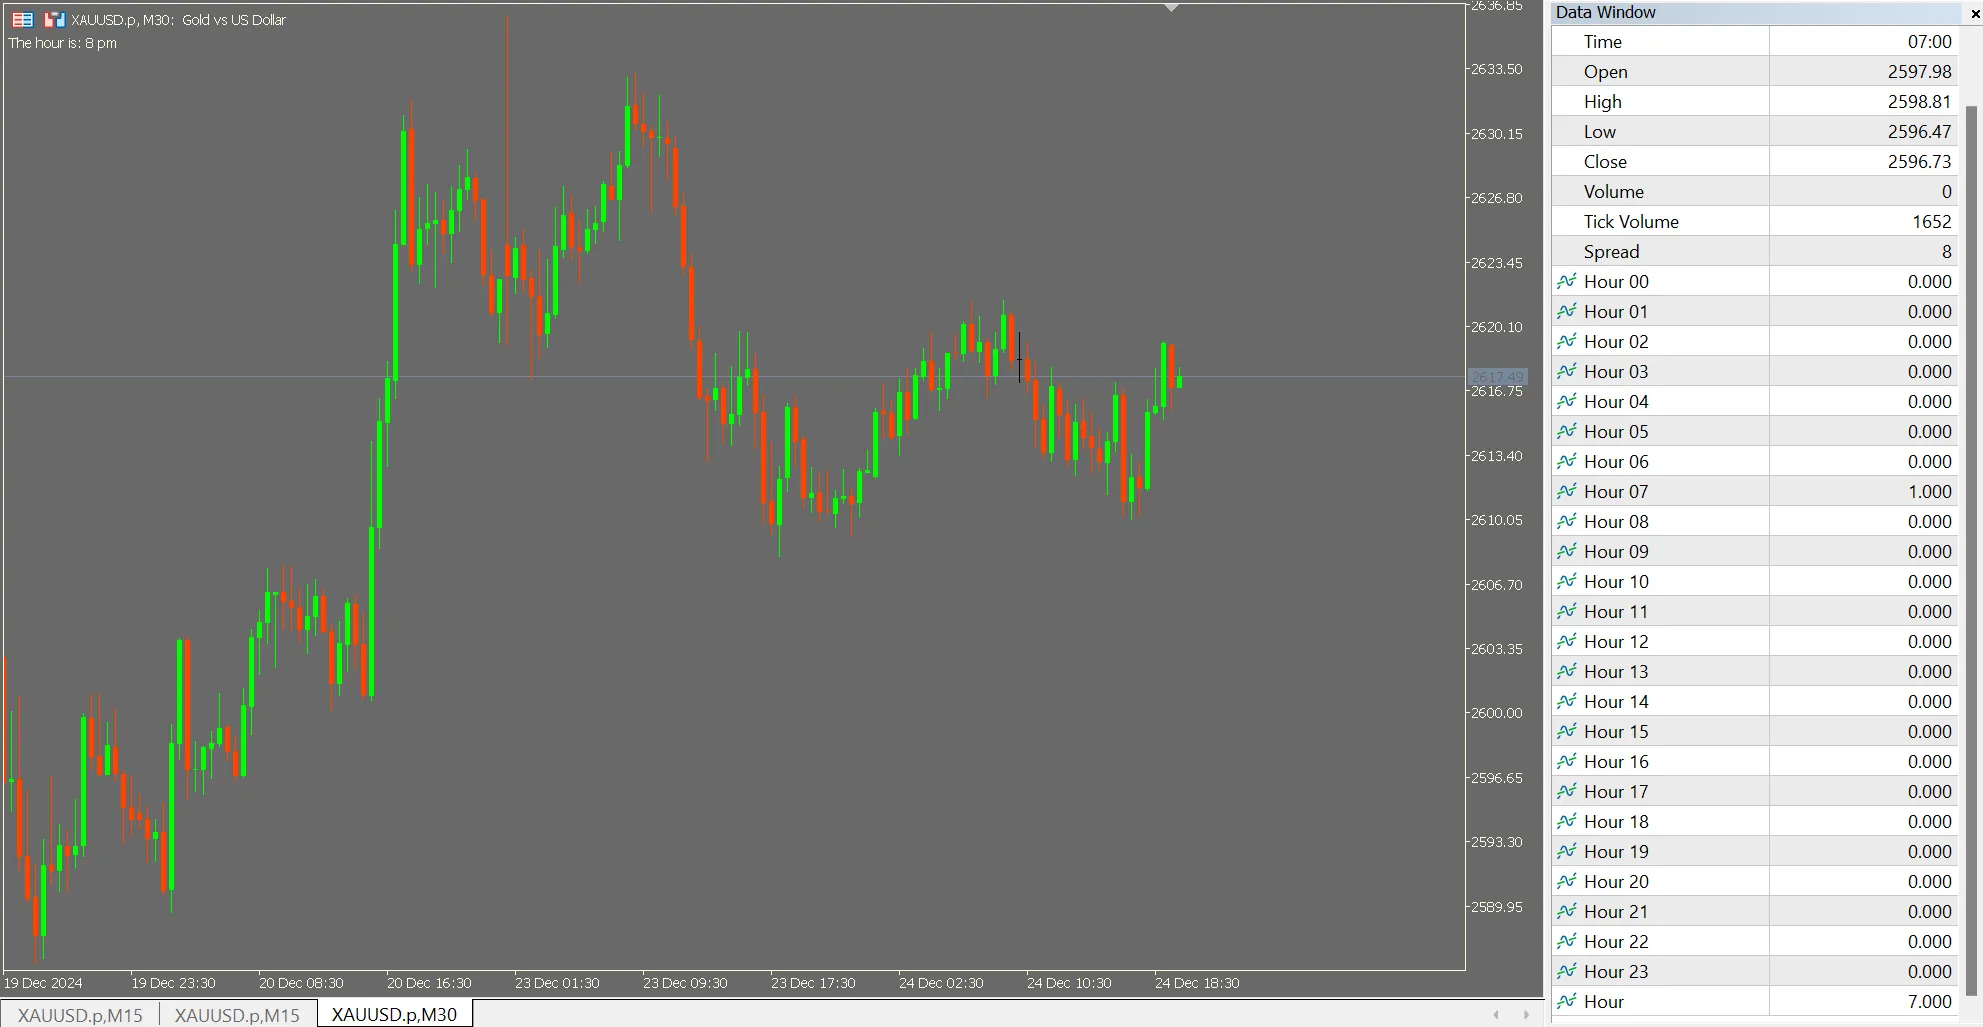
Purpose As traders, we often need to collect data for analysis and strategy modeling. This straightf...
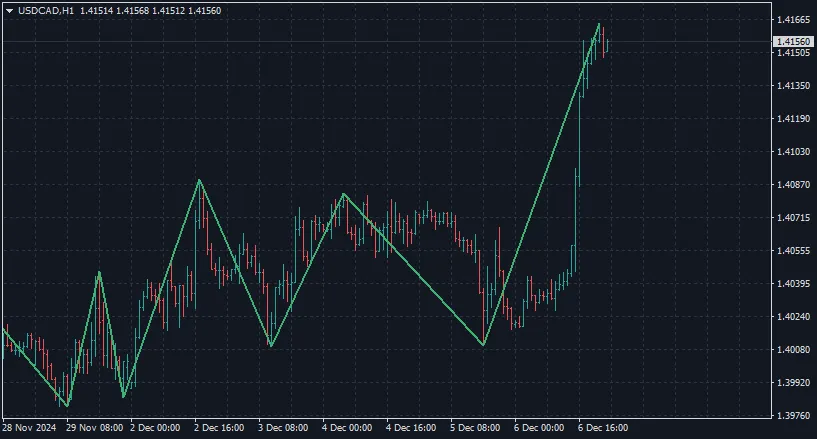
Hey fellow traders! Today, we're diving into the Auto Scale ZigZag indicator for MetaTrader 4. This ...
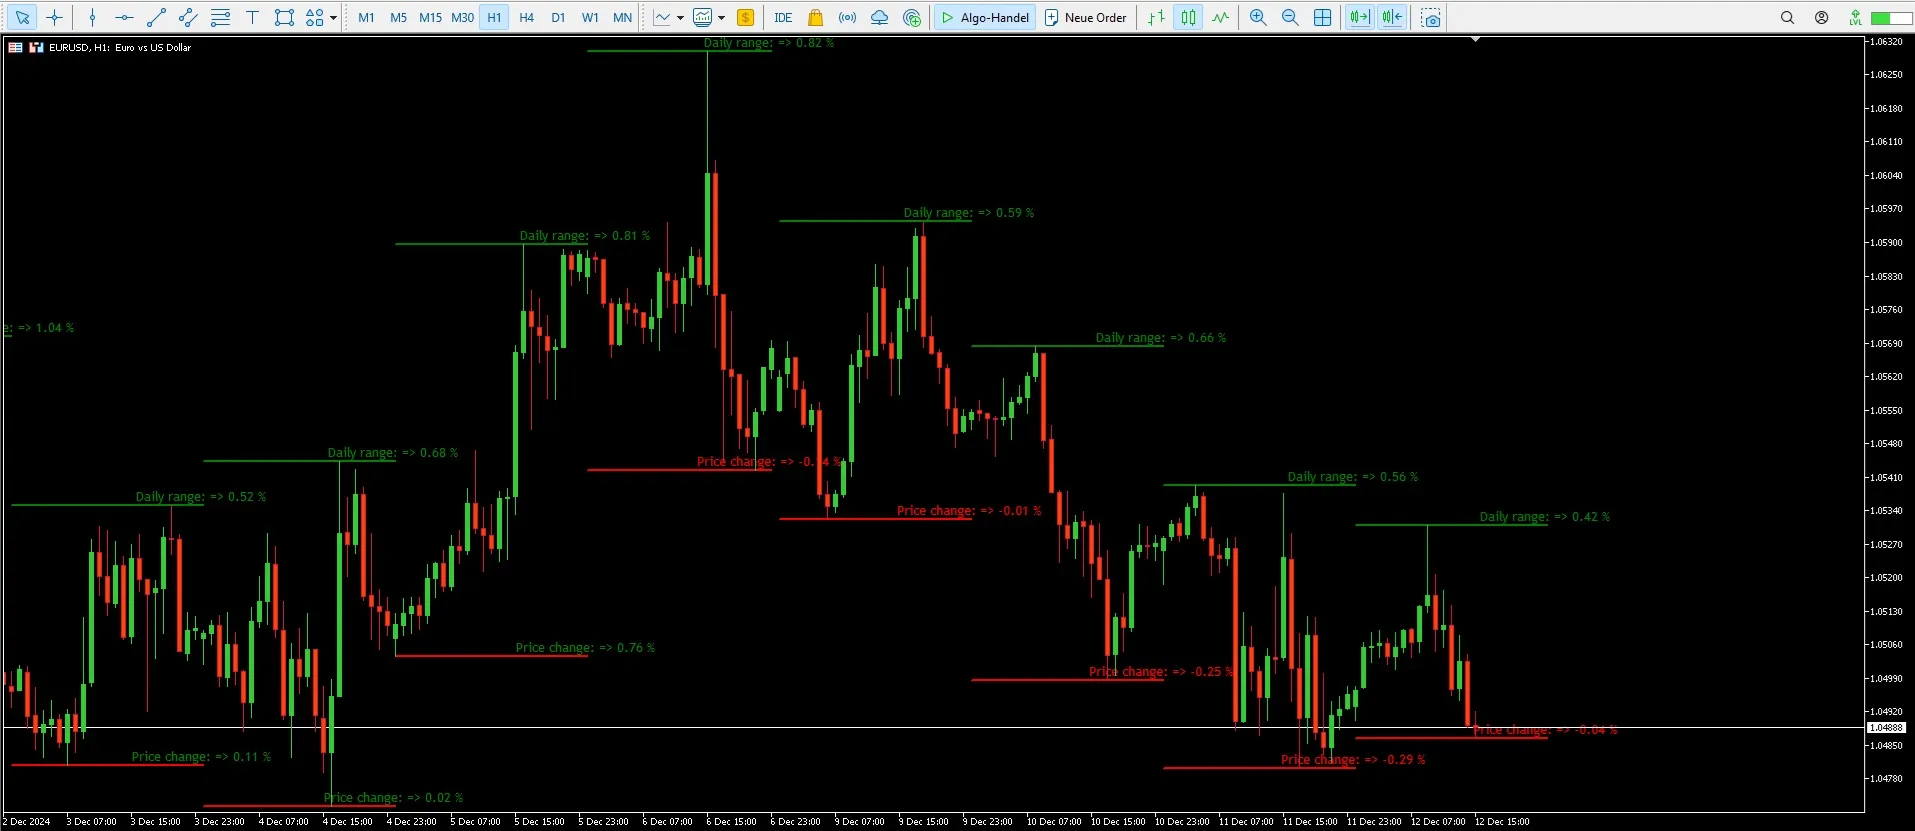
If you're looking to enhance your trading game, the Price Increase Indicator for MetaTrader 5 is a t...
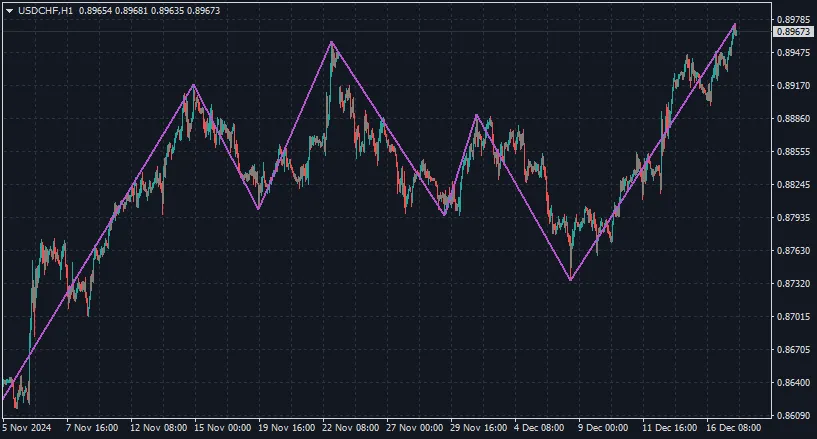
If you're looking to enhance your trading strategy, the ZigZag Step Points indicator for MetaTrader ...