If you're looking to enhance your trading strategy, the USDX_Slope indicator for MetaTrader 5 is a fantastic tool to consider. This indicator serves as an informative signal tool that evaluates the directional trends of two key indicators: USDX and Slope Direction Line. It displays colored signals in a separate window, indicating whether these two indicators are aligned or diverging in their trends.
Here’s a quick rundown of the five adjustable parameters you can tweak:
- SDL Period - This sets the calculation period for the Slope Direction Line.
- SDL Method - Here, you can choose the method used to calculate the Slope Direction Line.
- SDL Applied Price - This parameter defines which price is used for the Slope Direction Line calculation.
- USDX Slope Shift - Adjusts the shift between two data points to accurately identify the USDX line's direction.
- USDX Reverse - Choose whether to reverse the USDX chart (Yes/No).
- If both the USDX and Slope Direction Line are trending upwards:
- A green signal pointer appears.
- If both indicators are trending downwards:
- A red signal pointer shows up.
- In any other situation:
- A gray signal pointer is displayed.
Note: You don’t need to have the Slope Direction Line or USDX indicators loaded in your terminal, as the USDX_Slope indicator calculates them independently.
The USDX is calculated based on Close prices.
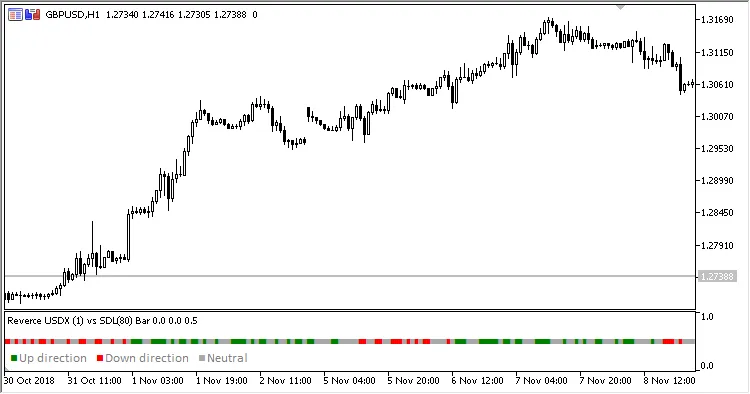
Fig. 1. USDX vs Slope Direction Line, USDX Reverse = Yes, Chart Scale = 2
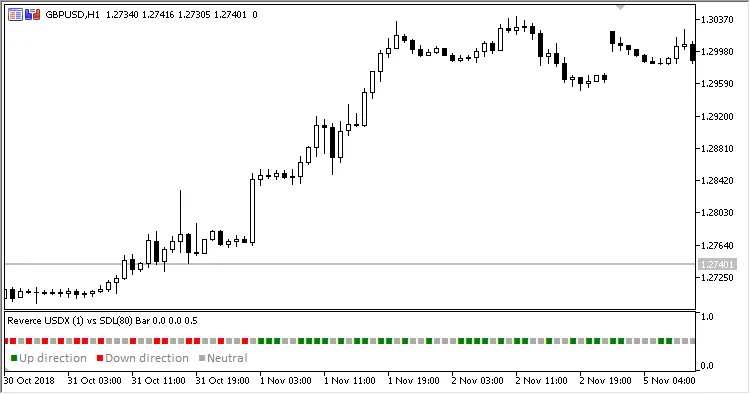
Fig. 2. USDX vs Slope Direction Line, USDX Reverse = Yes, Chart Scale = 3
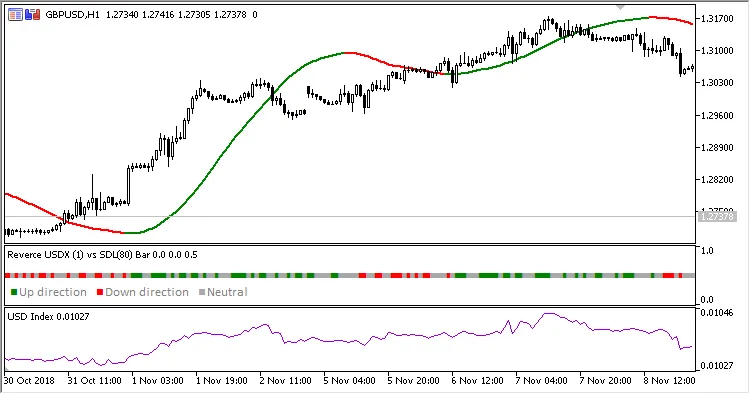
Fig. 3. USDX vs Slope Direction Line + USDX + Slope Direction Line, USDX Reverse = Yes, Chart Scale = 2
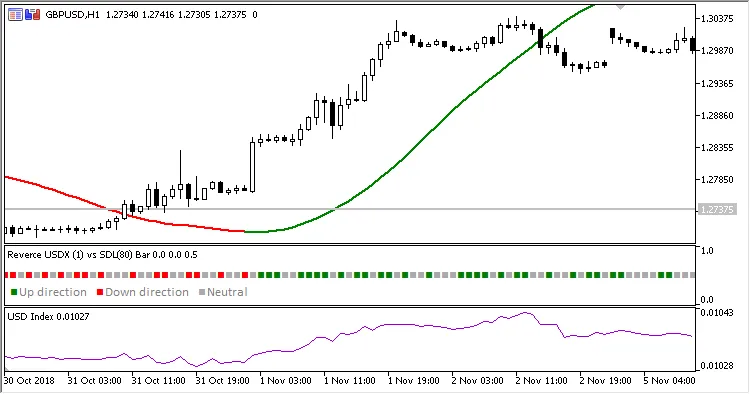
Fig. 4. USDX vs Slope Direction Line + USDX + Slope Direction Line, USDX Reverse = Yes, Chart Scale = 3


Comments 0