If you’re diving into the world of trading, you might want to take a closer look at the SAR_MACD_EA for MetaTrader 4. This expert advisor operates on a 15-minute bar or candle chart, leveraging the MACD as an early signal for market direction.
The primary focus here is the Parabolic SAR, which serves as the first signal for potential buy or sell opportunities. Here’s how it works: when the close of a bar or candle indicates a price action, we look back to see if the third candle prior was below the Simple Moving Average (SMA) while the previous candle closed above it. If the SAR flips below the price at this point, that's your buy signal. If the MACD shows a bullish move and the SAR is below the price, but the previous candle's close (close[1]) remains below the SMA, the strategy dictates waiting for five candles to see if the price closes above the SMA.
Let’s break this down with some examples:
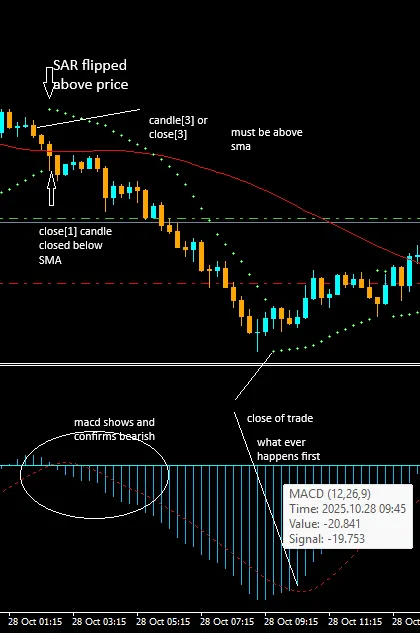
In the first example, you’ll notice that as soon as the candle closes below the SMA, the third candle should ideally be above it. During this timeframe, the SAR should also flip above the price. By this point, the MACD should confirm a bearish move, either simultaneously or in the previous candles.
Now, here’s a look at a buy scenario:

This visual demonstrates the ideal conditions for executing a buy based on our strategy. Keeping track of these signals can be a game-changer for your trading approach!


Comments 0