Strategy Author:
FXRaider.
EA Author:
Last Versions:
In this guide, we’ll dive into FXRaider's trading strategy, which uses three timeframes: W1, D1, and H4. As a fan of A. Elder, I’ve integrated some of his principles into my approach.
W1: Weekly Analysis
The W1 timeframe is straightforward. I use two Moving Averages (MAs) along with my Awesome indicator (details in the attached archive). I’ve tweaked the Awesome indicator to allow for customizable periods, as I find the default EMA settings aren’t always optimal for trading. The Awesome indicator resembles a MACD histogram but is set to a 36% decrease for better clarity.
Red MA:
Period: 55
Type of MA: Linear Weighted
Apply to: Close
Blue MA:
Period: 21
Type of MA: Linear Weighted
Apply to: Close
Awesome Indicator Settings:
Per_1: 8; Per_2: 13.
Determining the trend is simple. The primary indicator is represented by the two MAs. If the blue line is above the red line, we’re in an uptrend. Conversely, if the blue line sits below the red, we’re looking at a downtrend. The Awesome indicator serves as a secondary confirmation; if it aligns with the trend from the MAs, that’s a good sign, but it’s not a deal-breaker if it doesn’t.
I keep track of my observations in a table. If both indicators agree on W1, I’ll mark it as “up” in my notes. If the MAs say “up” but the Awesome says “down,” I still lean towards buying but with caution.
D1: Daily Insights
On the D1 timeframe, I track three indicators: t_ma (also included in the archive), Parabolic SAR, and my Awesome. The t_ma is a moving average based on a 34-period setting, with an additional moving average calculated over the last 6 bars.
The Parabolic SAR is primarily used for setting stop losses. It's a secondary indicator; if it deviates from the t_ma, I hold off on trading that currency pair.
When assessing direction, the t_ma takes precedence again. If the blue line is above the red line, I note “up.” If the SAR’s dots are below the price chart, it’s a green light to trade. If I notice a conflict, such as t_ma trending up while the SAR indicates down, I mark it as “up” but stay cautious.
H4: Hourly Strategy
On the H4 timeframe, I again utilize the same indicators: t_ma (34) and Awesome (8, 13). This timeframe allows for quicker signals and trades.
The entry conditions are straightforward. If I see t_ma trending up and Awesome is also aligned, I feel confident to buy. I place trades only when all indicators agree, as this timeframe offers the fastest signals.
In summary, I’m ready to buy when I see the following conditions met:
- W1: up or up
- D1: up or up
- H4: up
Take a look at how the EUR/USD pairs are performing according to my observations:
- W1: up
- D1: up
- H4 (9:00): up
Visuals:
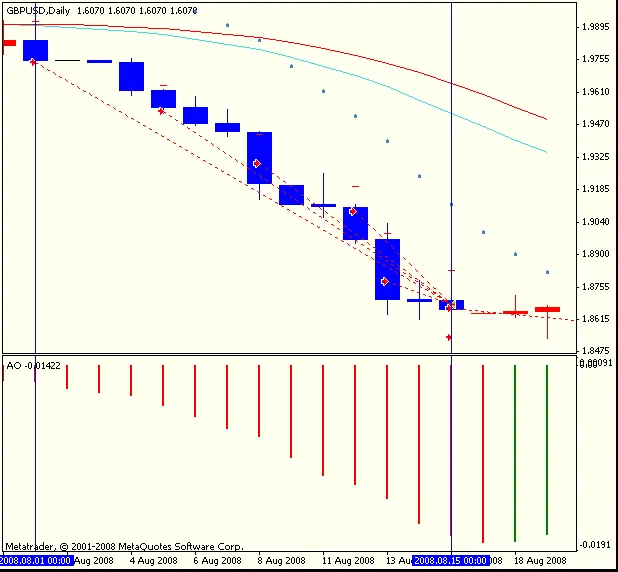

FXRaider's Trading System
Key Takeaways:
- Don’t forget to optimize and test your strategy on historical data. Some parameters may not have been fully optimized.
- Experiment with settings suited for shorter periods.
- Reassess your Stop Loss levels regularly.
- For detailed descriptions of the EA's parameters and FXRaider's strategy, check out the 34th issue of the journal.


Comments 0