Strategy Tester Report
Bull vs Medved
DeltaBank-Server (Build 218)
| Symbol | GBPUSD (Great Britain Pound vs US Dollar) | ||||
| Period | 4 Hours (H4) 2008.01.01 20:00 - 2008.09.30 20:00 (2008.01.01 - 2008.10.01) | ||||
| Model | Every tick (the most precise method based on all available least timeframes) | ||||
| Parameters | Lots=0.1; CandleSize=75; k_sl=0.8; k_tp=0.8; popravka_up=16; popravka_down=20; flag=true; StartTime="0:10"; StartTime1="4:05"; StartTime2="8:05"; StartTime3="12:05"; StartTime4="16:05"; StartTime5="20:05"; | ||||
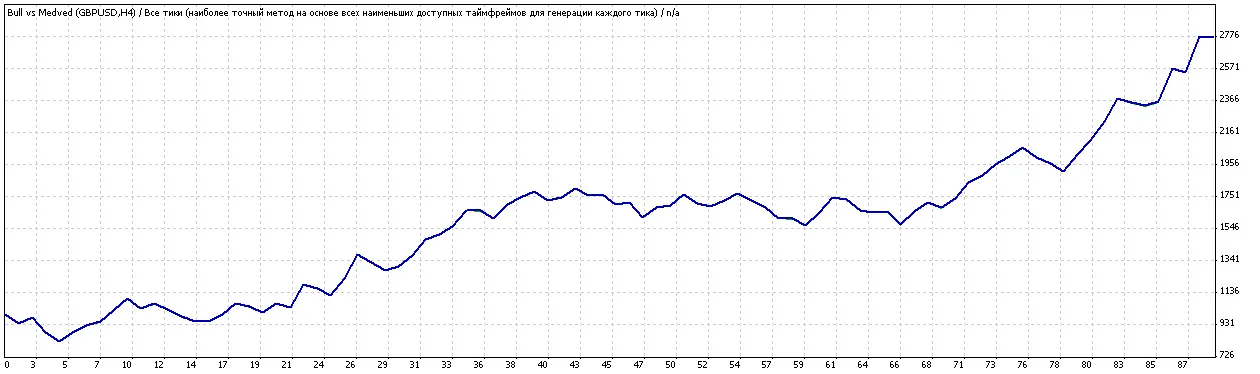
| Bars in test | 2038 | Ticks modelled | 1,748,343 | Modelling quality | n/a |
| Missmatched charts errors | 465 | ||||
| Initial deposit | £1,000.00 | ||||
| Total net profit | £1,774.25 | Gross profit | £3,467.50 | Gross loss | -£1,693.25 |
| Profit factor | 2.05 | Expected payoff | £19.94 | ||
| Absolute drawdown | £186.00 | Maximum drawdown | £288.00 (13.53%) | Relative drawdown | 20.43% (£209.00) |
| Total trades | 89 | Short positions (% won) | 64 (59.38%) | Long positions (% won) | 25 (52.00%) |
| Profit trades (% of total) | 51 (57.30%) | Loss trades (% of total) | 38 (42.70%) | ||
| Largest | profit trade | £228.00 | loss trade | -£97.00 | |
| Average | profit trade | £67.99 | loss trade | -£44.56 | |
| Maximum | consecutive wins (profit in money) | 6 (£386.00) | consecutive losses (loss in money) | 3 (-£163.00) | |
| Maximum | consecutive profit (count of wins) | £467.00 (4) | consecutive loss (count of losses) | -£163.00 (3) | |
| Average | consecutive wins | 2 | consecutive losses | 2 | |
In this report, we dive deep into the performance of the Bull vs Medved strategy on MetaTrader 4, using the DeltaBank server. With a focus on GBPUSD, the analysis covers various aspects of trading performance, from initial deposits to total net profit.
Whether you’re a seasoned trader or just starting out, understanding the metrics can significantly enhance your trading strategy. Stay tuned for more insights as we continue to explore effective trading systems!


Comments 0