ข้อดีของ ZigZag:
- ฟังก์ชัน iBarShift ที่มีประสิทธิภาพสูง ซึ่งช่วยในการค้นหาช่วงสูงสุดอย่างแม่นยำ
- ข้อมูลที่จำเป็นสำหรับการสร้าง ZigZag สำหรับทุกแท่งสามารถเข้าถึงได้ตลอดเวลา
- ไม่มีจุดสูงสุดที่ถูกหยุดชะงัก
- วิธีการค้นหาจุดสูงสุดที่มีประสิทธิภาพ
- รวดเร็วมาก
- ทำงานได้ถูกต้องในขณะการแทรกประวัติและเมื่อเปลี่ยนกรอบเวลา
- เหมาะสำหรับการใช้งานใน EA
ข้อเสียของ ZigZag:
1. ความต้องการหน่วยความจำ: อินดิเคเตอร์นี้ใช้บัฟเฟอร์ 5 แทนที่จะเป็น 2 (หรือแม้แต่ 1) เหมือนการใช้งานอื่นๆ แต่ (ตามความเห็นส่วนตัว) นี่ถือเป็นราคาที่ดีสำหรับข้อดีในข้อที่ 6 และ 7 เพราะ ZigZag ที่รวดเร็วที่ผมเคยเห็นไม่สามารถประมวลผลการแทรกประวัติได้โดยไม่ต้องสร้างใหม่ทั้งหมด แต่ของผมทำได้อย่างมีประสิทธิภาพ
2. เส้นเพิ่มเติมที่มีอยู่: จำเป็นต้องทำให้ข้อมูลมองเห็นได้สำหรับโค้ดภายนอก แต่เส้นเหล่านี้ไม่ควรปรากฏให้เห็น
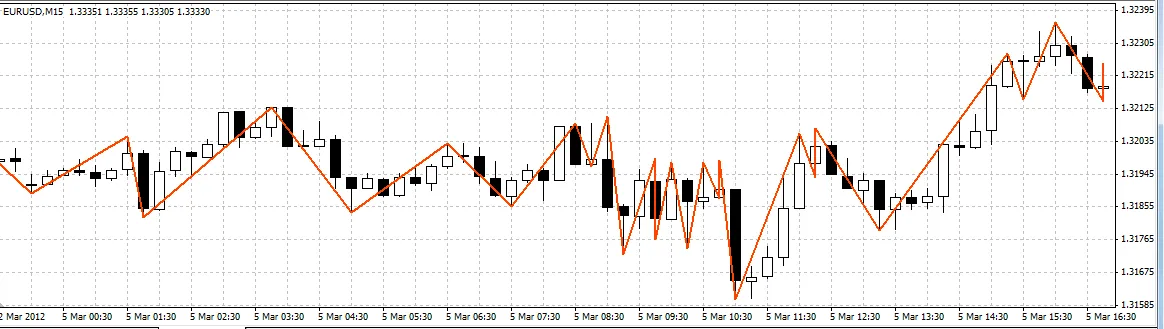
หลักการทำงาน:
ZigZag ถูกวาดด้วยหลักการของช่องสัญญาณ โดยสามารถกำหนดความกว้างของช่องในหน่วย Points (XLab_ZZ) หรือในเปอร์เซ็นต์ (XLab_ZZP)
การค้นหาช่วงสูงสุด:
extern int ChannelWidth = 100;

#property indicator_chart_window
#property indicator_buffers 1

#property indicator_color1 Red
#property indicator_width1 3

datetime LastTime;

int init()
{
   LastTime = 0;

   return(0);
}

bool GetValue(double dir, int bar, int prevBar, double& peak, int& peakBar, datetime& peakTime)
{
   if (dir < 0)
   {
      datetime t = iCustom(Symbol(), 0, "XLab_ZZ", ChannelWidth, 2, bar);
      int i = iBarShift(Symbol(), 0, t);

      if (i == prevBar)
      {
         t = iCustom(Symbol(), 0, "XLab_ZZ", ChannelWidth, 2, bar + 1);
         i = iBarShift(Symbol(), 0, t);
      }

      double v = iCustom(Symbol(), 0, "XLab_ZZ", ChannelWidth, 1, i);

      if (v == EMPTY_VALUE)
      {
         t = iCustom(Symbol(), 0, "XLab_ZZ", ChannelWidth, 2, bar + 1);
         i = iBarShift(Symbol(), 0, t);
         v = iCustom(Symbol(), 0, "XLab_ZZ", ChannelWidth, 1, i);
      }
      peak = v;
      peakBar = i;
      peakTime = t;
   }
   else if (dir > 0)
   {
      t = iCustom(Symbol(), 0, "XLab_ZZ", ChannelWidth, 3, bar);
      i = iBarShift(Symbol(), 0, t);

      if (i == prevBar)
      {
         t = iCustom(Symbol(), 0, "XLab_ZZ", ChannelWidth, 3, bar + 1);
         i = iBarShift(Symbol(), 0, t);
      }

      v = iCustom(Symbol(), 0, "XLab_ZZ", ChannelWidth, 0, i);

      if (v == EMPTY_VALUE)
      {
         t = iCustom(Symbol(), 0, "XLab_ZZ", ChannelWidth, 3, bar + 1);
         i = iBarShift(Symbol(), 0, t);
         v = iCustom(Symbol(), 0, "XLab_ZZ", ChannelWidth, 0, i);
      }
      peak = v;
      peakBar = i;
      peakTime = t;
   }
   else
   {
      return (false);
   }

   return (true);
}

int start()
{
   if (LastTime == Time[0]) return (0);
   LastTime = Time[0];

   double dir = iCustom(Symbol(), 0, "XLab_ZZ", ChannelWidth, 4, 1);
   double rdir = -dir;

   if (dir == EMPTY_VALUE) return (0);

   double v1, v2, v3, v4, v5;
   int    i1, i2, i3, i4, i5;
   datetime t1, t2, t3, t4, t5;

   GetValue(dir, 1, 0, v1, i1, t1);
   GetValue(rdir, i1, 0, v2, i2, t2);
   GetValue(dir, i2, i1, v3, i3, t3);
   GetValue(rdir, i3, i2, v4, i4, t4);
   GetValue(dir, i4, i3, v5, i5, t5);

   SetPt("1", v1, t1);
   SetPt("2", v2, t2);
   SetPt("3", v3, t3);
   SetPt("4", v4, t4);
   SetPt("5", v5, t5);

   Print(v1, "   ", v2, "  ", v3, "  ", v4, " ", v5, " ", i1, "  ", i2, "  ", i3, " ", i4, " ", i5);

   return(0);
}

void SetPt(string name, double price, datetime time)
{
   ObjectCreate(name, OBJ_ARROW, 0, time, price);
   ObjectSet(name, OBJPROP_ARROWCODE, 108);
   ObjectSet(name, OBJPROP_PRICE1, price);
   ObjectSet(name, OBJPROP_TIME1, time);
}
ตัวอย่างนี้เป็นอินดิเคเตอร์ที่ทำเครื่องหมาย (หนึ่งครั้งต่อแท่ง) สำหรับห้าช่วงสูงสุดแรก (รวมถึงช่วงที่กำลังสร้างอยู่ในขณะนั้น)
โปรดระวัง! โค้ดนี้อาจทำงานไม่ถูกต้องหากโหมด 0th Bar ถูกเปิดใช้งาน
โหมด 0th Bar:
ตั้งค่าได้ด้วยตัวแปร DrawZeroBar ซึ่งปิดใช้งานโดยค่าเริ่มต้น
ไม่แนะนำให้ใช้ตัวเลือกนี้ โดยเฉพาะอย่างยิ่งหากใช้อินดิเคเตอร์ใน EA
ขอให้สนุกกับการใช้งาน ;) หากมีคำถามเพิ่มเติมยินดีตอบเสมอ
หากพบข้อผิดพลาดใด ๆ กรุณาแจ้งให้ทราบ ขอบคุณครับ
โพสต์ที่เกี่ยวข้อง
- เครื่องมือ Open Range Breakout สำหรับ MetaTrader 5
- เครื่องมือ Master Tools - อินดิเคเตอร์สำหรับ MetaTrader 4
- สัญญาณข้ามค่าเฉลี่ยเคลื่อนที่ครั้งเดียว - เครื่องมือช่วยเทรดใน MetaTrader 4
- FX Multi-Meter II: เครื่องมือช่วยเทรดที่ครบครันสำหรับนักลงทุน
- Volume Profile + Range v6.0: เครื่องมือวิเคราะห์การซื้อขายใน MetaTrader 5