Theory:
The original calculation of the Relative Strength Index (RSI) is pretty straightforward:
First, we add up the price changes—both up and down. From these totals, we can calculate the RSI. Welles Wilder, the creator of the RSI, sometimes referred to this method as Wilder's EMA for smoother results. This foundation allows us to create various types of RSIs by applying different smoothing techniques at the final calculation.
This version:
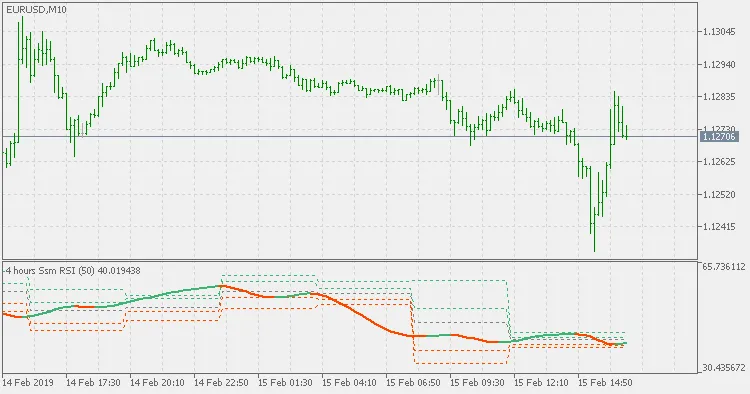
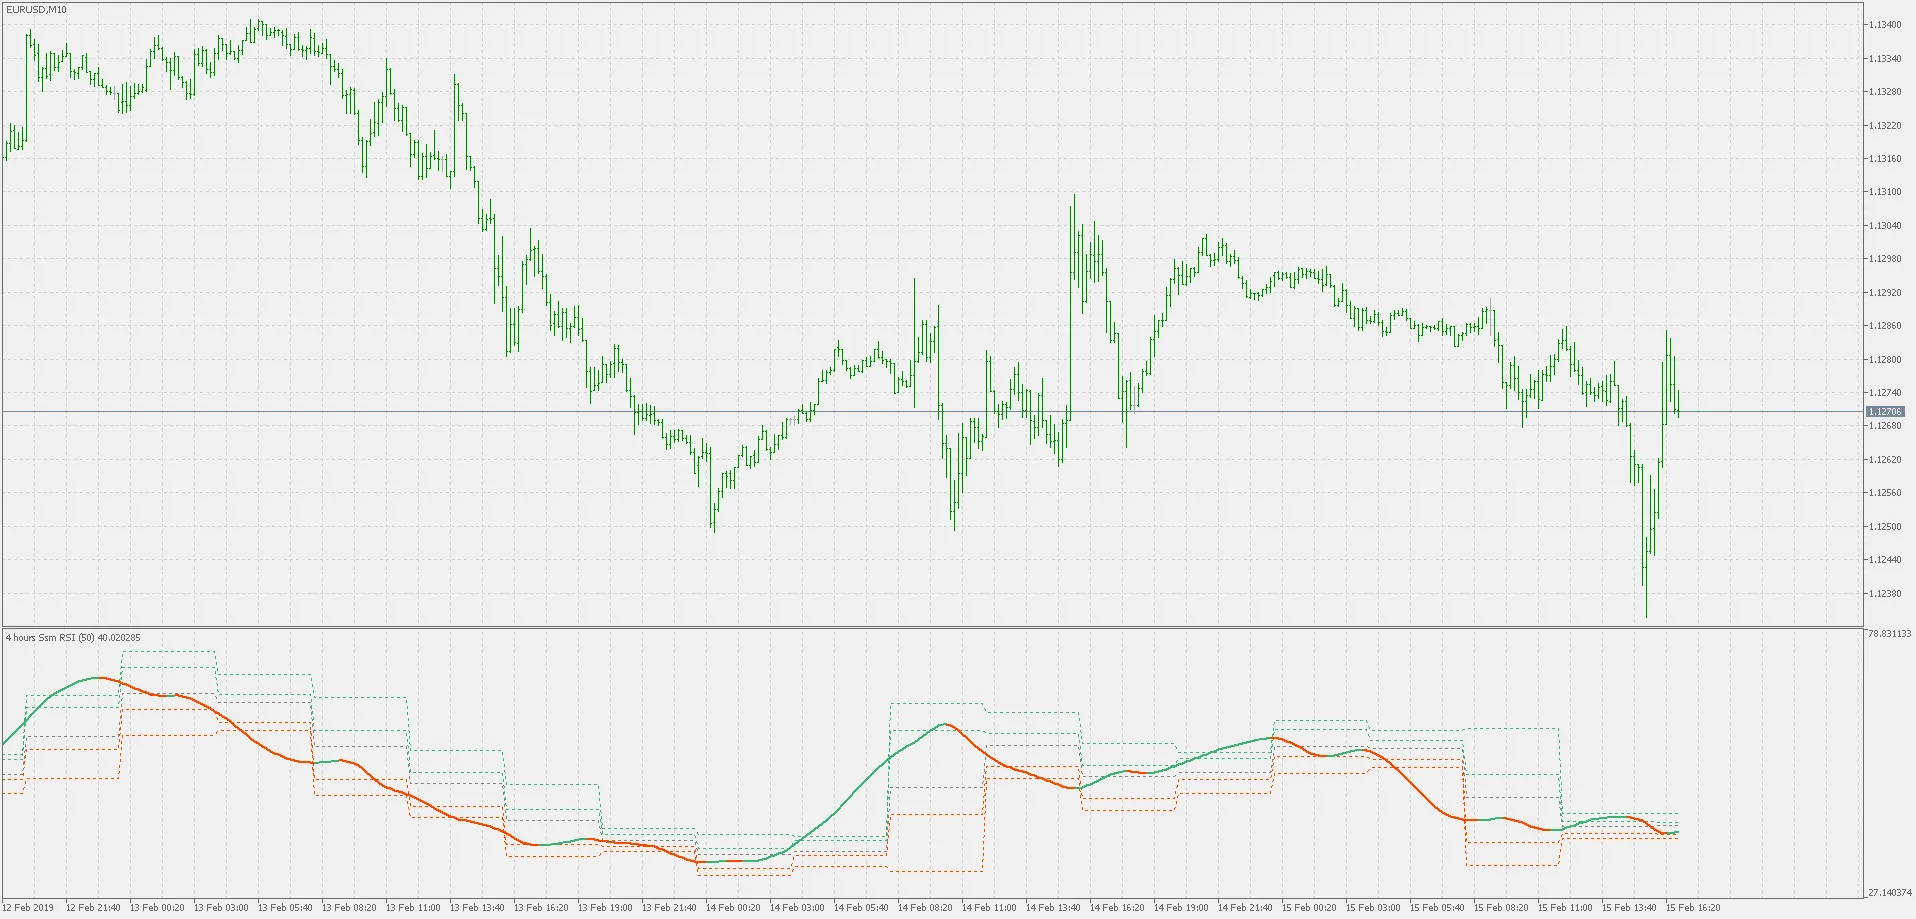
This iteration utilizes a super smoother for RSI calculations, generating outcomes similar to the RSX developed by Mark Jurik. However, the differences are significant enough to warrant consideration as a distinct type of RSI.
Additionally, this version incorporates pivot calculations based on the RSI itself, giving you four display options:
- Display pivot only
- Display pivot and 1st level support and resistance
- Display pivot along with 1st and 2nd level support and resistance
- Display pivot and 1st, 2nd, and 3rd level support and resistance
The selected time frame is used solely for pivot calculations, acting as a delimiter. The RSI, however, is always computed based on the current time frame.
Usage:
You can use this indicator just like any other RSI.


Comments 0