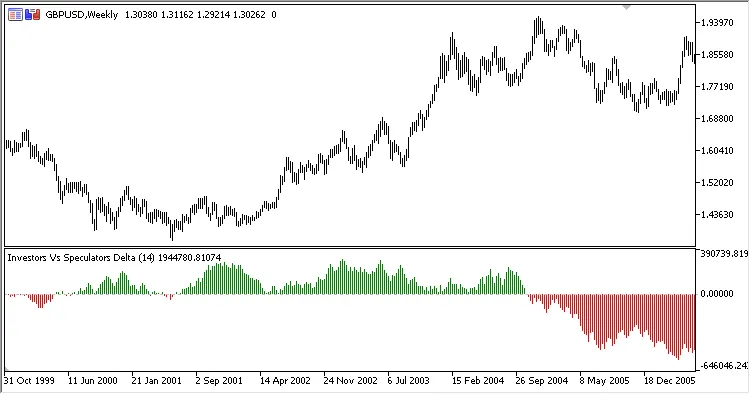
The Investors vs Speculators Delta indicator is a handy tool for traders looking to gauge the market dynamics between big players (Investors) and everyday traders (Speculators). This version is yet another exciting addition to the Investors vs Speculators toolkit, presenting the ratio through a colorful histogram that makes understanding market sentiment a breeze.
Let’s dive into the two key parameters you can tweak:
- Period - This sets the calculation timeframe.
- AD Method - This refers to the accumulation/distribution calculation method:
- Classical MT - The standard method used in MetaTrader.
- Trade Station - The method familiar to Trade Station users.
How the Calculation Works:
Delta = Investors - Speculators
Here’s how it breaks down:
- If VOL > AVG
Speculators = PrevSpeculators
Investors = PrevInvestors + AD
- Otherwise
Investors = PrevInvestors
Speculators = PrevSpeculators + AD
- If AD method = Classical MT
AD = ((Close - Low) - (High - Close)) / (High - Low) * VOL
- If AD method = Trade Station
AD = (Close - Open) / (High - Low) * VOL
AVG - SUM/Period
VOL - tick volume
SUM - VOL sum excluding the current tick (starting from PrevVOL) within the selected Period


Comments 0