Theory:
The Dynamic Momentum Index (DMI) was originally crafted by Tushar Chande and Stanley Kroll to help traders identify whether a security is overbought or oversold. While it shares similarities with the Relative Strength Index (RSI), the DMI stands out with its flexibility. The RSI typically uses a fixed period—often 14 days—but the DMI adapts based on market volatility, adjusting its timeframe from as short as five to as long as 30 days.
This particular version of the DMI takes a different approach:
- It utilizes the RSX, which gives smoother results compared to the traditional RSI.
- It incorporates standard deviation to adaptively calculate the RSX.
- Floating levels replace fixed levels for overbought/oversold signals. This version, akin to the previously published but now discontinued signal lines, allows for greater flexibility. Unlike the old signal lines, which oscillated around a “central” value, the floating levels operate without such constraints.
Usage:
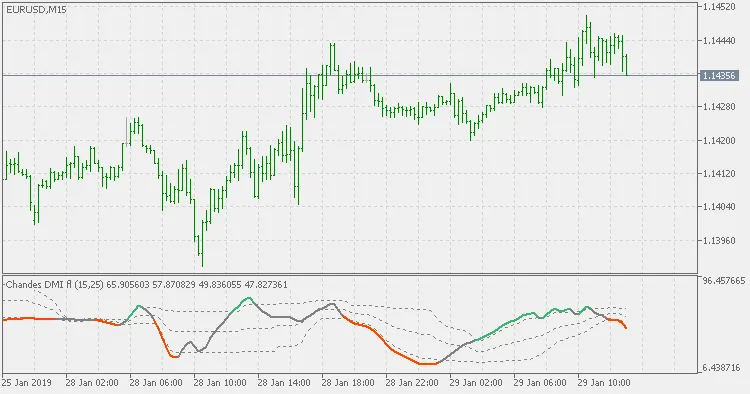
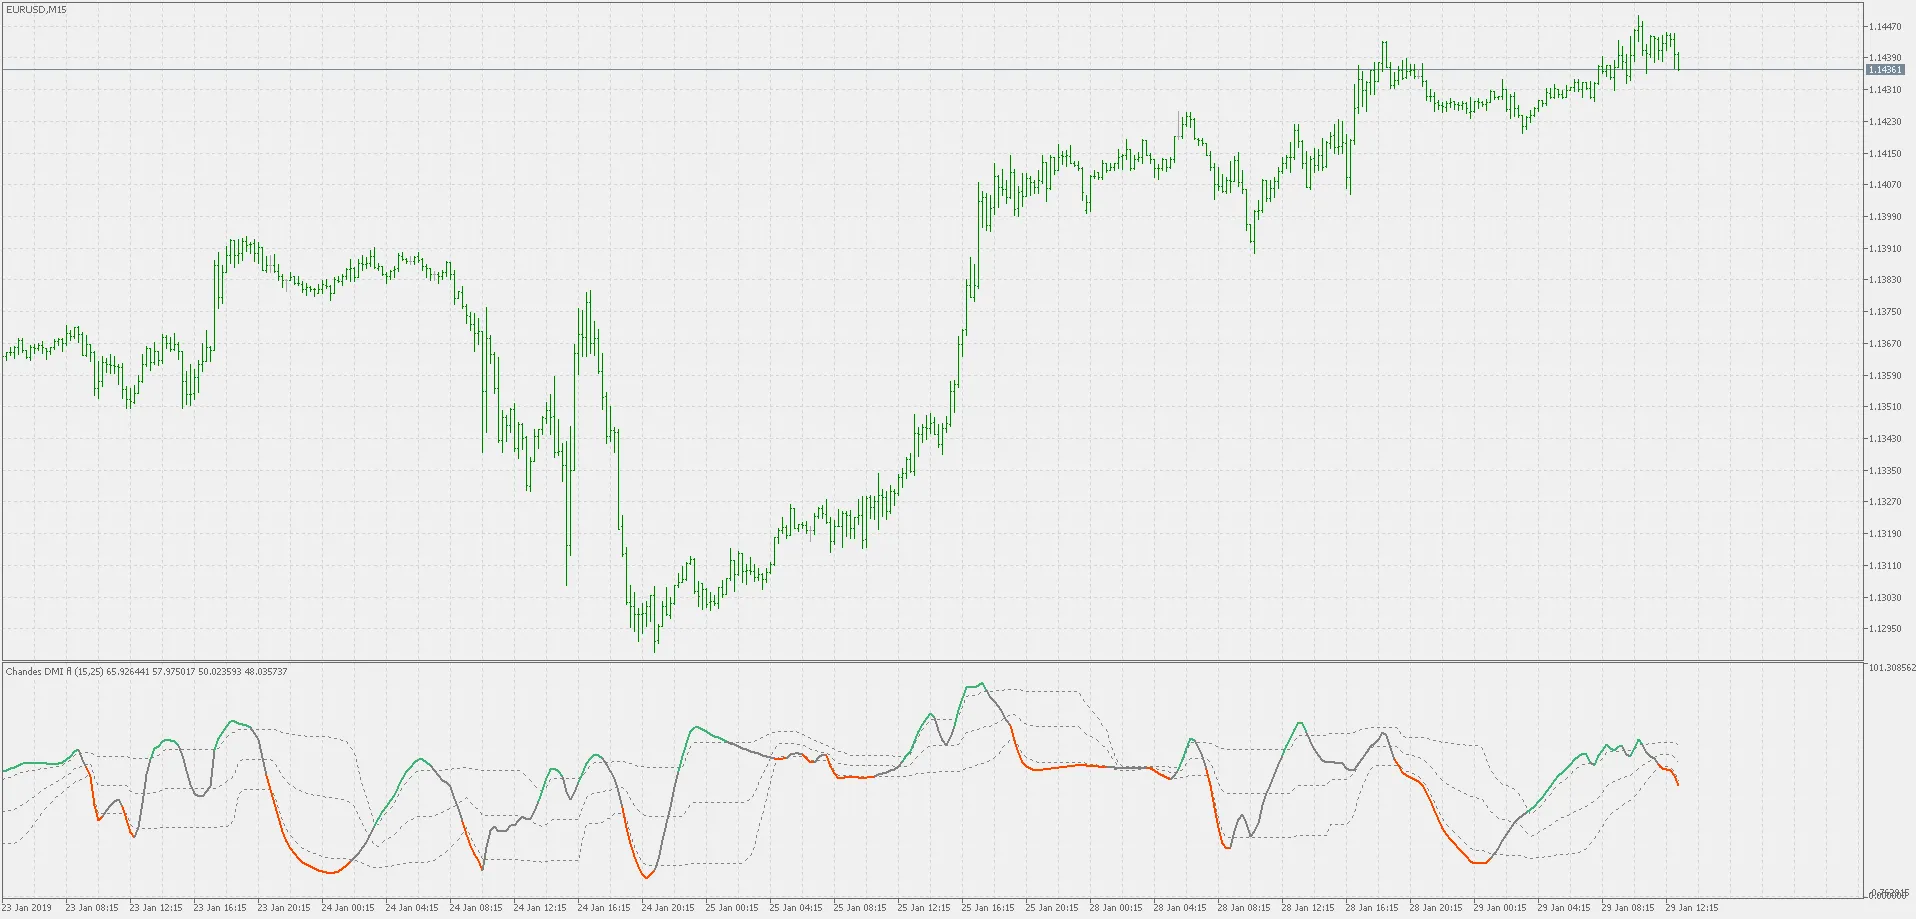
As you incorporate the DMI into your trading strategy, watch for color changes as signals:
- A color change on a slope change can indicate a shift in momentum.
- A color change when crossing outer levels signals potential reversals.
- Crossing the middle level, calculated as the average of the upper and lower levels, offers a new “zero” line (or the 50 line in DMI terms) that can act as a pivotal indicator.


Comments 0