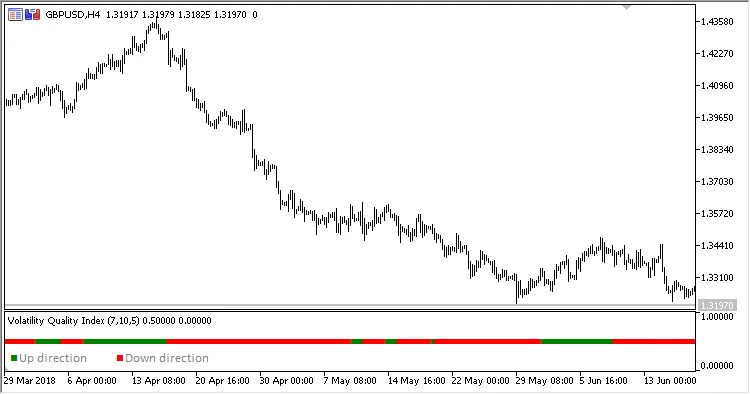
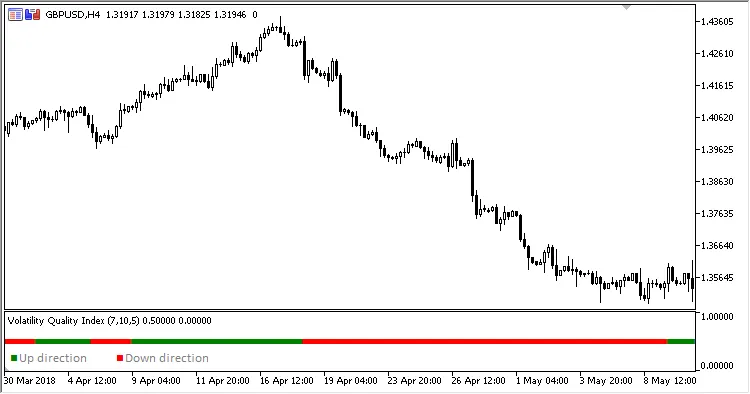
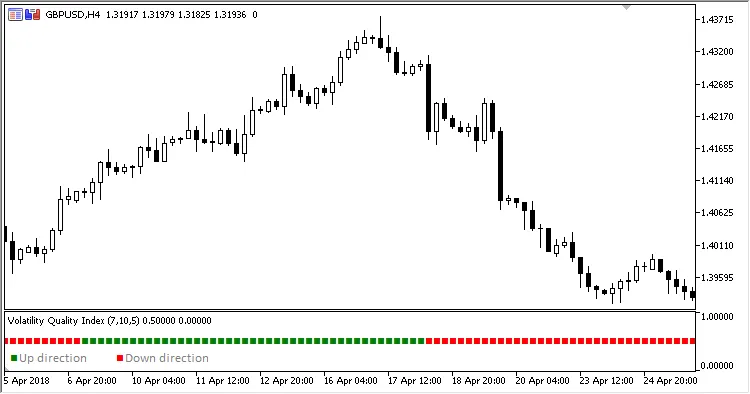
The Volatility Quality Index (VQI) is a trend-based indicator that provides valuable insights into up and down trends on your MetaTrader 5 platform. Whether you’re a seasoned trader or just starting out, understanding how to read this indicator can enhance your trading strategy.
Here’s a quick rundown of the four adjustable parameters that you can tweak:
- Period - This defines the calculation period for the indicator.
- Method - Determines the calculation method used.
- Smoothing - Adjusts the smoothing period for the data.
- Filter - Sets the size of the filter applied.
Here’s how the calculations work:
- If VQ > 0
The trend is up - a green signal pointer is displayed. - Otherwise
The trend is down - a red signal pointer is displayed.
Where:
- If (Abs(VQnew) < Filter
VQ = PrevVQ - Otherwise
VQ = VQnew
VQnew = Abs(((Close - C2) / Max + (Close - Open) / (High - Low)) * 0.5) * ((Close - C2 + (Close - Open)) * 0.5)
Max = Maximum(High - Low, Maximum(High - C2, C2 - Low))
Open = MA(Open, Period, Method)
High = MA(High, Period, Method)
Low = MA(Low, Period, Method)
Close = MA(Close, Period, Method)
C2 = Close Smoothing bars ago
Related Posts
- Unlocking MetaCOT 2: Your Ultimate CFTC Indicator Toolkit for MT4
- Mastering the MACD Candle Indicator for MetaTrader 4
- Unlocking the Power of Master Tools for MetaTrader 4
- Visualize Current Trends Across All Time Frames with This MetaTrader 4 Indicator
- Hourly Buffers for Data Collection in MetaTrader 5: A Simple Guide