Hey fellow traders! Today, I want to walk you through the Polar Coordinate System indicator in MetaTrader 5. This handy tool can help you visualize price movements in a unique way. To get the most out of it, make sure you set your chart to show unlimited data history. You can do this by navigating to Tools ->Options ->Charts and adjusting the “Max bars in chart” setting.
Now, let's break down how the mouse position affects the Polar Coordinate System:
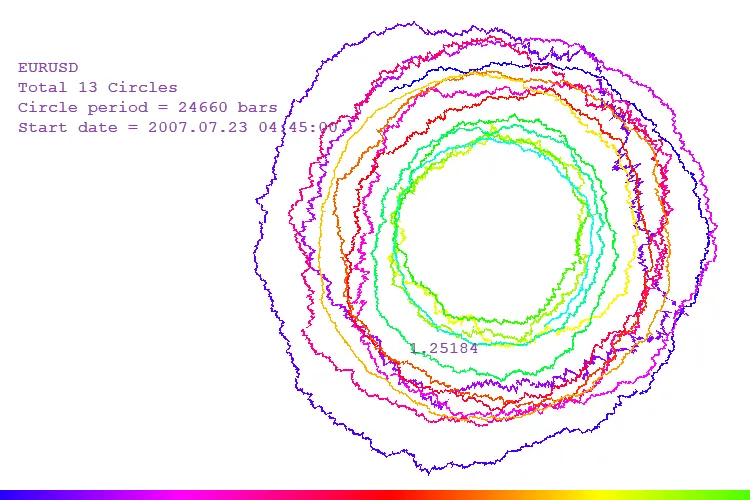
- The start date of the data displayed changes based on where your mouse is positioned on the X-axis. For maximum data visibility, place your mouse on the far left.
- The period of each loop adjusts according to the Y-axis. The minimum period can be found at the top of the chart.
To apply any changes you've made, simply click the left mouse button.
Additionally, pressing the D key toggles between two chart modes:
- In the first mode, each circle's size is based on a fixed number of bars.
- In the second mode, the circle size corresponds to a fixed time interval. For example, if you're using a minute chart, one loop represents a full day (24 hours), with 0 hours at the top and noon at the bottom.
The colors on the chart indicate the date. At the bottom, there's a color scale that you can hover over to see the corresponding date. If you want to check the price, just move your mouse over the chart!


Comments 0