The Hurst Exponent is a valuable tool for traders, offering insights into the long-term memory of time series data. Essentially, it examines the autocorrelations of a series and how these correlations decrease as the time lag between values increases. Interestingly, the concept of the Hurst exponent originated from research in hydrology, specifically for calculating the optimal sizing of dams along the Nile River, which faced extreme weather patterns over the years. The term 'Hurst exponent' honors Harold Edwin Hurst (1880 - 1978), the pioneering researcher behind these studies. The letter H used to denote this coefficient is derived from his name as well.
Often referred to as the "index of dependence" or "index of long-range dependence," the Hurst exponent helps traders understand whether a time series is likely to revert to its mean or trend in a particular direction.
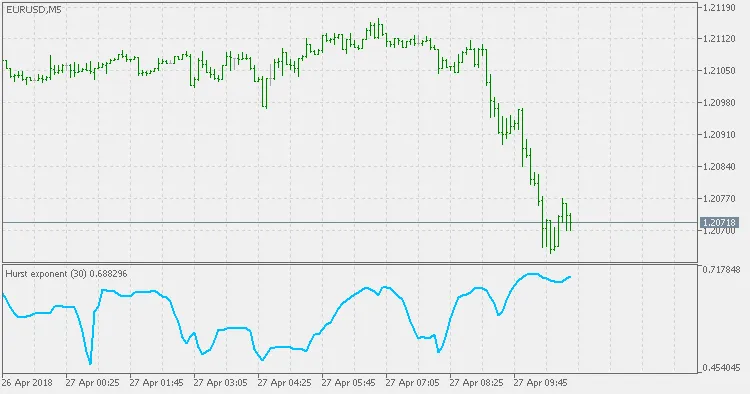
- A value of H between 0.5 and 1 suggests a time series with long-term positive autocorrelation. This means that if the series experiences a high value, it is likely to be followed by another high value, and future values will also tend to remain high.
- A value of H in the range of 0 to 0.5 indicates a series that frequently switches between high and low values. Essentially, a high value is likely to be followed by a low one, and this alternating pattern can persist over time.
- If H equals 0.5, it often points to an uncorrelated time series. However, this can also mean that while autocorrelations at short time lags may vary, they decay quickly to zero. This is in contrast to the power law decay observed in the other ranges.


Comments 0