Theory:
The Dynamic Momentum Index (DMI), developed by Tushar Chande and Stanley Kroll, is a powerful tool in technical analysis. This indicator helps traders identify whether a security is overbought or oversold. While it shares similarities with the Relative Strength Index (RSI), the key difference lies in its adaptability. Unlike the RSI, which typically uses a fixed period (usually 14), the DMI adjusts its timeframes between five to 30 based on market volatility.
This particular version of the DMI has some notable enhancements:
- It employs RSX instead of RSI for more refined calculations, resulting in a much smoother output.
- It incorporates standard deviation adjustments to refine the RSX calculations.
- It features dynamic signal lines rather than fixed levels for identifying overbought (OB) and oversold (OS) conditions.
Usage:
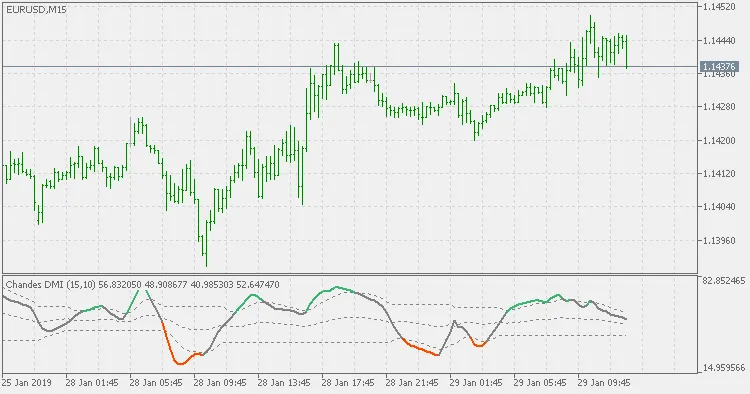
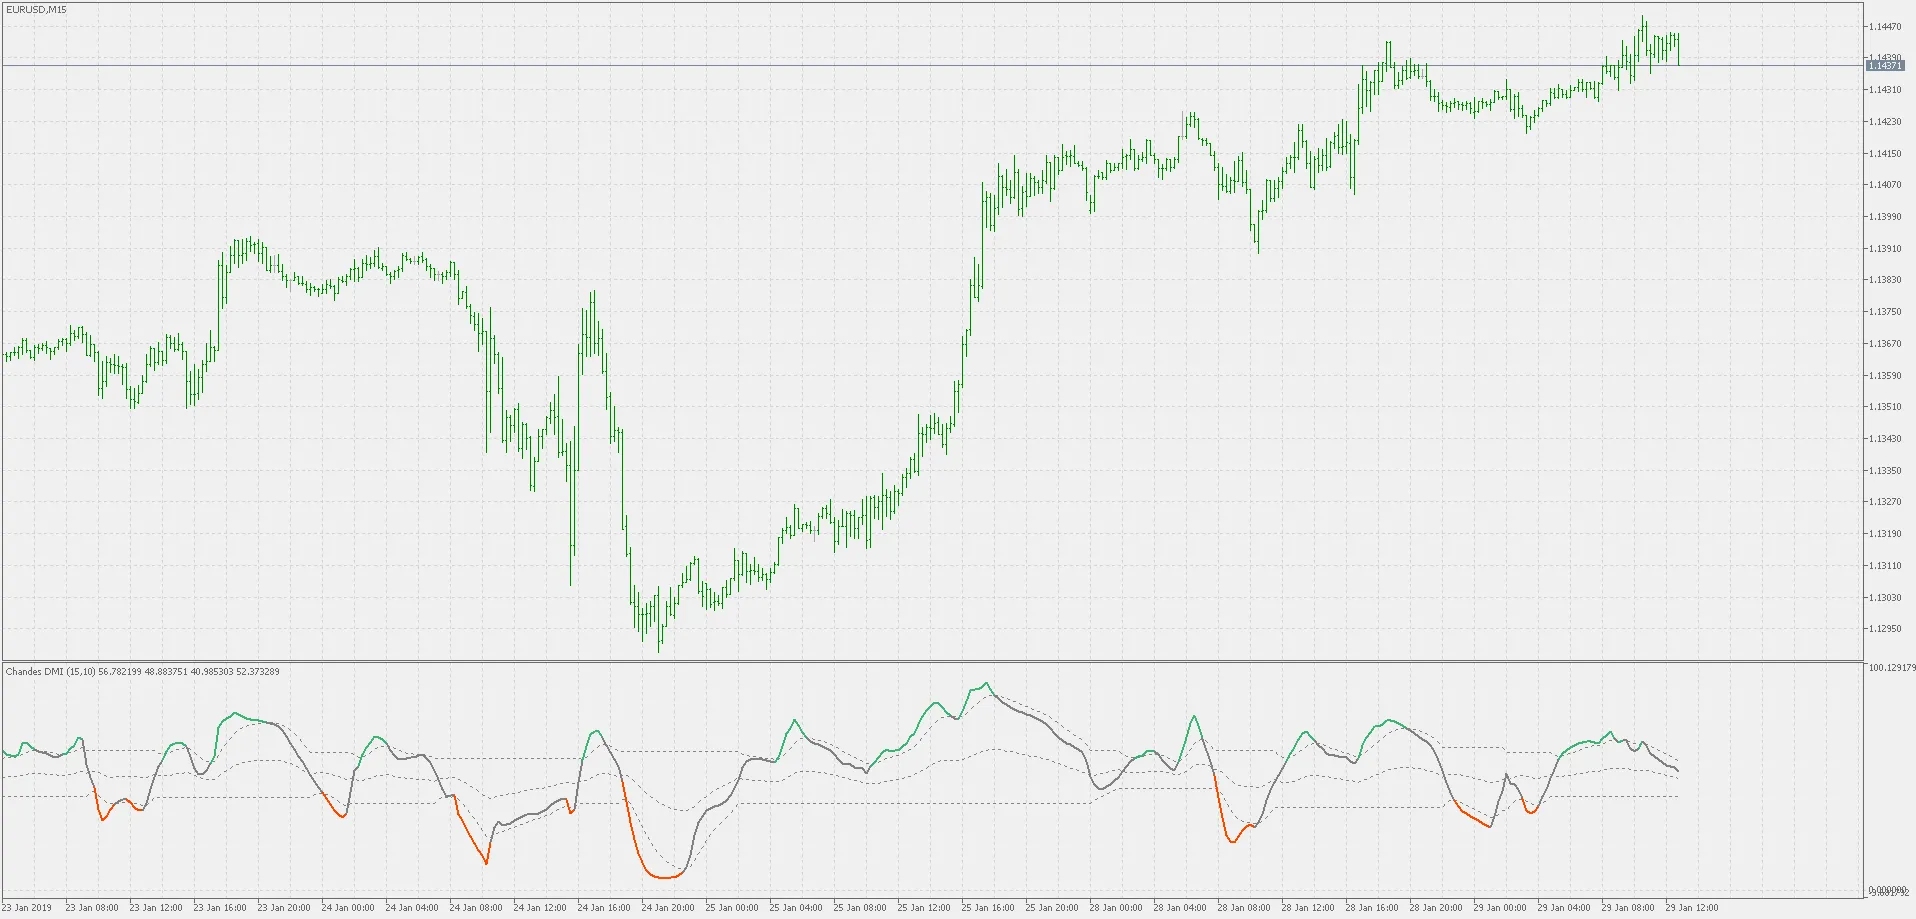
Traders can interpret color changes in the DMI as actionable signals. Here’s what to look for:
- A color shift on slope changes.
- A color change when the outer dynamic signal lines cross.
- A color change when the middle dynamic signal lines cross. This middle line is calculated as the average of the upper and lower lines, serving as an effective zero line (or 50 line in the case of DMI).


Comments 0