Description:
Bollinger Bands, often referred to as BB, are a popular technical indicator that can really enhance your trading game. Think of them as a more dynamic version of Envelopes. While Envelopes are set a fixed percentage away from a moving average, Bollinger Bands adjust according to market volatility by plotting a certain number of standard deviations away from that moving average. This means that as the market shifts, so do the bands!
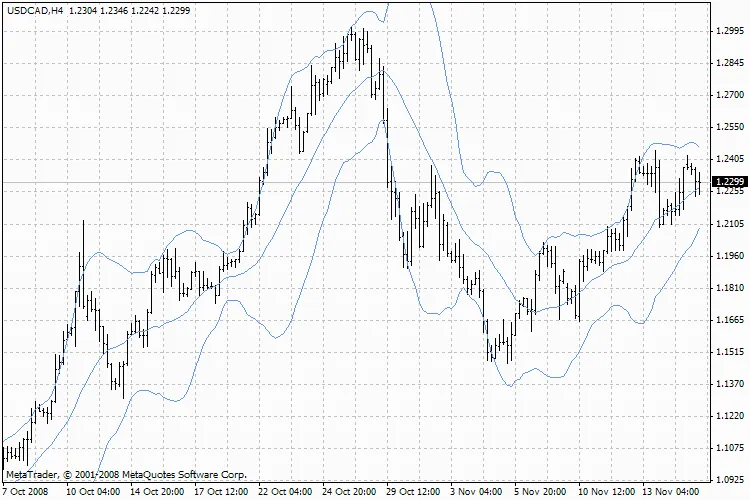
You’ll typically see Bollinger Bands displayed on your price chart, but you can also include them in your indicator chart. Just like with Envelopes, the key to interpreting Bollinger Bands is understanding that prices usually hang out between the upper and lower bands. One of the standout features of this indicator is its variable width, which reflects price volatility. When the market gets choppy, the bands widen, creating space for price movements. Conversely, during calmer periods, the bands tighten, keeping prices within a narrower range.
Here are some important characteristics to keep in mind when using Bollinger Bands:
- Sharp price changes often follow a period when the bands have contracted due to lower volatility.
- If prices break above the upper band, it usually signals that the current trend is likely to continue.
- When you see peaks and valleys outside the bands, followed by peaks and valleys inside the bands, it may indicate a potential trend reversal.
- Price movements that start from one of the band’s lines typically reach the other line, which can be useful for forecasting support and resistance levels.
Calculation:
Bollinger Bands consist of three lines. The middle line (ML) is a standard Moving Average.
ML = SUM [CLOSE, N]/N
The upper line (TL) is the middle line plus a certain number of standard deviations (D).
TL = ML + (D * StdDev)
The lower line (BL) is the middle line minus the same number of standard deviations.
BL = ML - (D * StdDev)
Where:
- N — the number of periods used in the calculation;
- SMA — Simple Moving Average;
- StdDev — Standard Deviation.
To calculate Standard Deviation, use the following formula:
StdDev = SQRT(SUM[(CLOSE - SMA(CLOSE, N))^2, N]/N)
For practical use, it’s recommended to set your middle line as a 20-period Simple Moving Average and position the upper and lower bands two standard deviations away from it. Be cautious with moving averages shorter than 10 periods, as they may not provide reliable signals.
Technical Indicator Description
You can find a full description of Bollinger Bands in the Technical analysis: Bollinger Bands.


Comments 0