If you're looking to enhance your trading strategy, the Multi-Timeframe (MTF) Stochastic RSI indicator for MetaTrader 5 is a game changer. This oscillating indicator gives you insights from multiple timeframes right on your current chart, making it easier to spot trends and make informed decisions.
The MTF Stochastic RSI combines data from three different Stochastic RSI indicators, allowing you to get a comprehensive view of market momentum. Here’s a quick breakdown of its ten input parameters:
- Stochastic %K Period: This sets the calculation period for the %K line of the Stochastic indicator.
- Stochastic %D Period: Defines the calculation period for the %D line.
- Stochastic Slowing: Sets the period for slowing the Stochastic calculation.
- RSI Period: This indicates the period used for calculating the RSI.
- Overbought Level: Sets the threshold for overbought conditions.
- Oversold Level: Sets the threshold for oversold conditions.
- Drawing Mode: Choose how the indicator is displayed:
- Steps: Displays the indicator in steps.
- Slope: Displays the indicator as sloping lines.
- First Stochastic RSI Timeframe: Select your first Stochastic RSI timeframe.
- Second Stochastic RSI Timeframe: Choose your second timeframe.
- Third Stochastic RSI Timeframe: Set your third timeframe.
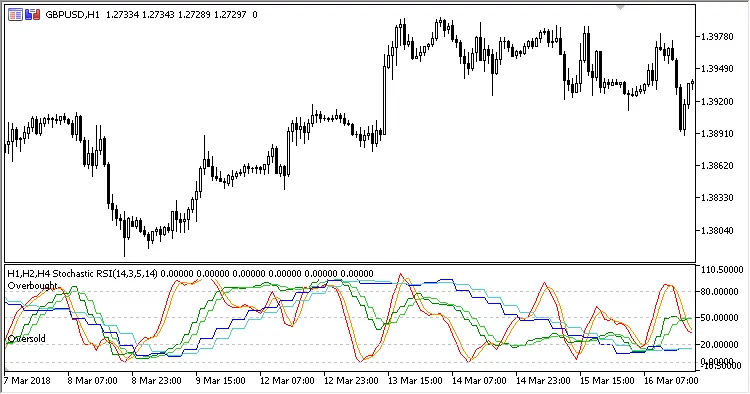
Fig. 1. MTF Stochastic RSI with Drawing Mode = Steps
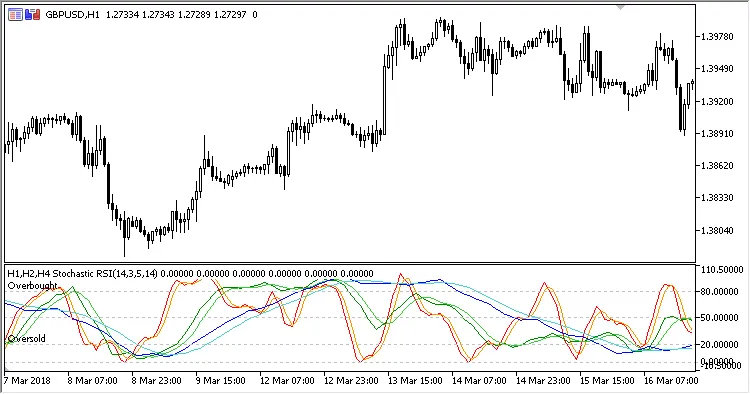
Fig. 2. MTF Stochastic RSI with Drawing Mode = Slope
By utilizing the MTF Stochastic RSI, you can get a layered understanding of market conditions, helping you to make more strategic trades. Whether you’re a novice or a seasoned trader, this tool is worth adding to your arsenal!


Comments 0