Hey fellow traders! Today, let’s dive into a powerful tool that can help elevate your trading game – the Swing Chart. Originating from the legendary trader W.D. Gann, this indicator is a fantastic way to spot trends and trade in sync with the market.
Understanding the Swing Chart
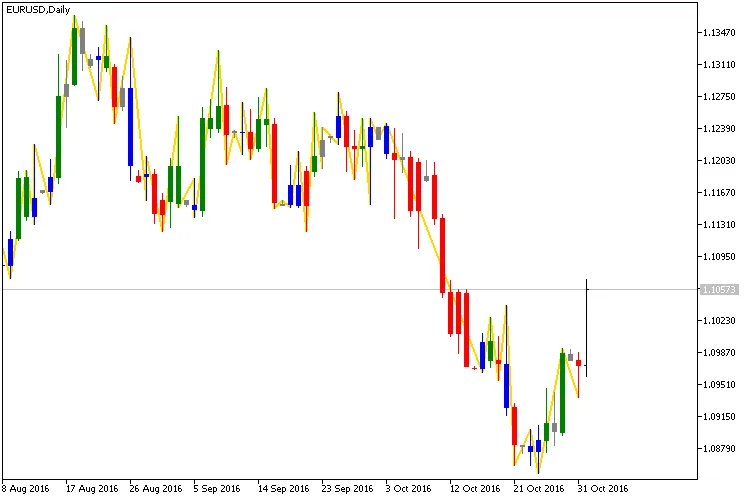
A Swing Chart is all about visualizing market movements through colored bars. Here’s how it breaks down:
- Green – Known as an "Up-day" when the bar has both a higher high and a higher low.
- Red – This represents a "Down-day" when the bar features a lower low and lower high.
- Blue – If you see a bar with a higher high and a lower low, that’s an "Outside-day."
- Grey – An "Inside-day" or "Harami" occurs when a bar has a lower high and a higher low.
Once you've colored the bars, you can draw a ZigZag line to highlight peaks and troughs where the colors change, such as from green to red and vice versa.
This method accounts for edge cases, defining an Up-day where the high is higher than or equal to the previous day’s low. The result? A ZigZag that accurately shows price maxima and minima without redrawing past swings, even allowing for bursts in activity during inside-days.
Your Trading Strategy Using Swing Charts
Now, let’s get into how you can profit from the Swing Chart:
- When a peak forms, set a buy stop just above the last peak if it’s higher than the previous one. Place your stop loss below the trough. For example, you’d set a buy stop at the high of the last green bar, with a stop loss at the low of the next red bar. If done right, you could already be in profit!
- Conversely, when a trough appears, set a sell stop below the last trough if it’s lower than the next-to-last. Again, place your stop loss above the peak.
How Does This Compare to Other ZigZags?
When we think about ZigZag indicators for technical analysis and Expert Advisors, there are a few key properties we want:
- No redrawing of previous peaks and troughs as new bars form.
- Accurate identification of significant peaks and troughs while ignoring the noise.
- Each ZigZag segment should clearly define the maximum and minimum price.
While standard ZigZags can draw clean swings, they often redraw themselves, making them less reliable for trading. Tools like FastZZ focus on price only and rely on retracement size, which can lead to missing important data or including irrelevant movements. The Swing Chart ZigZag strikes a balance, maintaining its integrity while adapting to dynamic price ranges. This means you’ll capture all the relevant peaks and troughs, making it a valuable addition to your trading toolkit.


Comments 0