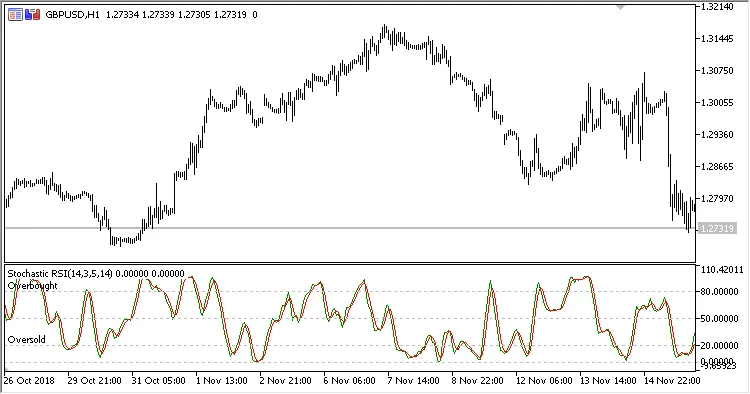
The Stochastic RSI is a powerful tool that combines the Stochastic Oscillator and the Relative Strength Index (RSI) to give traders a deeper insight into market conditions.
This indicator comes with six customizable parameters to help you tailor it to your trading strategy:
- Stochastic %K period: This defines the calculation period for the %K line.
- Stochastic %D period: This sets the period for the %D line calculation.
- Stochastic slowing: This parameter controls the slowing calculation period for the Stochastic.
- RSI period: This is the period used for the RSI calculation.
- Overbought: This level indicates the overbought threshold.
- Oversold: This level indicates the oversold threshold.
Here’s how the calculations work:
SK = AvgSKI
SD = AvgSK
Where:
AvgSKI = SMA(SKI, Stochastic slowing)
AvgSK = SMA(SK, Stochastic %D period)
SKI = (RSI - Min) / (Max - Min) * 100.0
Max, Min - the highest and lowest RSI values over the Stochastic %K period
RSI - Relative Strength Index (Close, RSI period)
Understanding how to effectively use the Stochastic RSI can enhance your trading strategy by helping you pinpoint potential reversal points in the market. So, give it a go and see how it fits into your trading toolkit!


Comments 0